

Review Sentiment
Review sentiment is the share of your reviews that are positive, neutral or negative, tracked overall and by topic, location and period.
| Review Sentiment at a glance | |
|---|---|
| Measures | How guests feel in what they write about you, counted across your reviews |
| Basic formula | Positive (or negative) reviews ÷ reviews analyzed × 100 |
| Topic formula | Negative mentions of a topic ÷ all mentions of that topic × 100 |
| Unit | Percentage of reviews or mentions, often shown as a positive / neutral / negative split |
| Usually broken down by | Topic, location, platform and period |
| Common restaurant topics | Food, service, wait time, value, cleanliness, atmosphere, order accuracy |
| Produced by | Sentiment analysis of review text, usually aspect-based |
| Companion metrics | Star rating, review volume, net sentiment, reputation score |
Key takeaways
- Review sentiment tells you what share of your reviews are positive, neutral or negative, and it becomes most useful when you split it by topic and location.
- The text of a review explains the star rating, so review sentiment shows you which part of the guest experience is lifting or dragging each location.
- A topic's impact depends on how often guests mention it as well as how negative those mentions are, which is why negative mentions per 100 reviews is a helpful companion figure.
- Period-over-period changes are where review sentiment earns its keep, as long as you check that the change is bigger than the normal month-to-month noise.
- The value comes from giving each topic an owner, from the kitchen to the general manager, and checking whether the next period's sentiment moves.
What is Review Sentiment?
Review sentiment is the measure of how guests feel in the reviews they write about you. It's usually reported as the share of reviews that are positive, neutral or negative, and for restaurants it's most useful when broken down by topic, such as food, service, wait time, value and cleanliness.
The labels themselves come from sentiment analysis, the AI technique that reads each review and decides what the guest felt about each topic. Review sentiment is what you do with those labels: you count them, compare them between locations and follow them from month to month.
For a multi-location restaurant brand, that turns thousands of reviews into a short list of answers. You can see which locations guests praise for service, where complaints about wait times are growing, and whether last month's fix actually changed what guests write.
How to calculate review sentiment
Review sentiment starts with a simple share at the level of the whole review:
Positive review share = positive reviews ÷ reviews analyzed × 100
The same calculation gives you the neutral and negative shares, and the three add up to 100%. Many teams count only reviews with written text, since a star-only rating gives the analysis nothing to read.
Topic sentiment works on mentions instead of whole reviews, because one review can praise the food and criticize the wait:
Topic negative share = negative mentions of the topic ÷ all mentions of the topic × 100
Topic mention rate = reviews mentioning the topic ÷ reviews analyzed × 100
Worked review sentiment example
Suppose one of your locations received 300 reviews with text last month: 204 positive, 36 neutral and 60 negative overall. Its review sentiment is 68.0% positive, 12.0% neutral and 20.0% negative. Here is the same month by topic:
| Topic | Reviews mentioning it | Positive | Negative | Negative share | Mention rate | Negative mentions per 100 reviews |
|---|---|---|---|---|---|---|
| Food | 180 | 138 | 30 | 16.7% | 60.0% | 10.0 |
| Service | 120 | 84 | 30 | 25.0% | 40.0% | 10.0 |
| Wait time | 75 | 15 | 54 | 72.0% | 25.0% | 18.0 |
| Value | 45 | 18 | 18 | 40.0% | 15.0% | 6.0 |
| Cleanliness | 24 | 12 | 12 | 50.0% | 8.0% | 4.0 |
Wait time stands out on both counts. Its negative share is 54 ÷ 75 × 100 = 72.0%, and it produces 54 ÷ 300 × 100 = 18.0 negative mentions per 100 reviews, almost double food or service.
Cleanliness looks alarming at 50% negative, yet it comes up in only 24 reviews. The last column, negative mentions per 100 reviews, multiplies how negative a topic is by how often guests raise it, which makes it a practical way to rank where to act first.
Review sentiment calculator
This calculator compares two periods, such as last month and this month, for one location or your whole brand. Enter how many reviews were positive, neutral and negative in each period. You'll see how the negative share moved and whether the change is bigger than normal random variation.
The margin of error uses a standard approximation for the difference between two proportions. It's a sanity check for one location or one topic, and it shows why a small location's sentiment can swing by several points without anything changing in the restaurant.
Types of review sentiment
Overall review sentiment
The overall split counts each review once, as positive, neutral or negative. It's the simplest figure to report to leadership and the easiest to compare over time, although it hides which part of the visit drove each review.
Review sentiment by topic
Topic sentiment, built on aspect-based analysis, scores each subject a review mentions. For restaurants, the topics that matter most are usually food, service, wait time, value, cleanliness, atmosphere, order accuracy and, for off-premise orders, delivery and packaging.
Most tools use a fixed list of topics so that trends stay comparable. Some also discover new topics as guests raise them, which helps you catch something like a new menu item or a parking change.
Review sentiment by location
The location view is where review sentiment becomes an operating tool. It shows which locations struggle with which topics, so a regional manager can see that one store has a wait-time problem while another has a cleanliness one. An operator report brings these comparisons into one weekly view.
Review sentiment by platform
Guests write differently on each platform. Delivery app reviews tend to focus on order accuracy, temperature and packaging, while Google and Tripadvisor reviews cover the dine-in experience more fully. Keeping platforms separable stops a shift in your review mix from looking like a change in quality.
Review sentiment trend
A trend line compares the same measure over consecutive periods, such as weekly negative share for wait time. Trends are often more useful than any single number, because they show whether a change in staffing, recipes or layout moved what guests write.
Review sentiment vs. star rating
Your star rating and your review sentiment come from the same reviews, yet they answer different questions. The rating says how satisfied guests were overall, and the sentiment in the text explains the reasons.
| Question | Star rating | Review sentiment |
|---|---|---|
| How did guests feel overall? | Average stars, such as 4.3 | Positive, neutral and negative shares |
| Why did they feel that way? | Not shown | Topic-level sentiment |
| What changed this month? | Moves slowly, especially with many reviews | Topic shifts show up within weeks |
| Which team owns the fix? | Unclear | Each topic maps to an owner |
| What do guests see? | Shown on every listing | Visible only in the review text itself |
The two usually move together, with some useful exceptions. Five-star reviews often contain a small complaint, and many 3-star reviews mix praise for the food with frustration about the wait, so the mixed middle of your ratings is where topic sentiment adds the most.
Because the rating is an average of everything guests have posted, it reacts slowly. A rise in negative wait-time mentions this month will barely move a rating built on thousands of reviews, which makes review sentiment an earlier warning.
Review sentiment vs. related metrics
| Metric | What it measures | Typical range |
|---|---|---|
| Review sentiment | Share of reviews or mentions that are positive, neutral or negative | 0–100% for each share |
| Net sentiment | Percentage positive minus percentage negative | −100 to +100 |
| Star rating | Average of the ratings guests gave | 1 to 5 |
| Reputation score | A composite of rating, volume, recency and other review metrics | Varies by provider |
| Customer satisfaction score | Share of surveyed guests who report being satisfied | 0–100% |
Net sentiment compresses review sentiment into a single score, which is handy for dashboards. Reporting the full split alongside it keeps a rise in neutral reviews from going unnoticed, since a net score treats neutral reviews as if they weren't there.
What is a good review sentiment?
No independent body publishes a restaurant benchmark for review sentiment. Tools also define positive, neutral and negative slightly differently, so a figure from one provider rarely compares cleanly with another's.
In practice, three comparisons tell you the most:
- Your own trend. A location whose negative share drops from 20% to 14% over a quarter is improving, whatever the absolute level.
- Your locations against each other. Within one brand, the same menu and the same tool make location comparisons fair, and the gap between your best and weakest stores shows what's achievable.
- Topics against each other. A topic with a high negative share and a high mention rate deserves attention before one that is rarely raised.
How to measure review sentiment
- Bring every review into one place. Review aggregation collects Google, Yelp, Tripadvisor, delivery and booking reviews with their location, platform, date and rating.
- Classify each review and topic. A sentiment analysis tool labels the overall review and each topic it mentions.
- Keep the topic list stable. A fixed set of topics, with occasional additions, keeps your trends comparable from one quarter to the next.
- Choose a reporting window. Monthly works for most brands; small locations benefit from a rolling 30- or 90-day window.
- Report shares and volumes together. Each percentage reads more clearly next to the number of reviews or mentions behind it.
- Read a sample of the reviews. A quick read of the comments behind a moving topic confirms what the numbers suggest and catches misclassified reviews.
How to act on review sentiment
Review sentiment pays off when each topic reaches the person who can change it. A simple ownership map makes that routine:
| Topic | Usual owner | Typical actions |
|---|---|---|
| Food | Kitchen manager, culinary team | Recipe checks, holding times, portion standards |
| Service | General manager, front-of-house leads | Coaching, staffing on peak shifts, recognition |
| Wait time | Operations, scheduling | Labor plans, kitchen flow, quoting accurate waits |
| Value | Marketing, pricing | Portion and price review, promotions, menu clarity |
| Cleanliness | General manager | Checklists, restroom rounds, closing routines |
| Order accuracy | Kitchen and off-premise leads | Packing checks, ticket labeling, delivery partner follow-up |
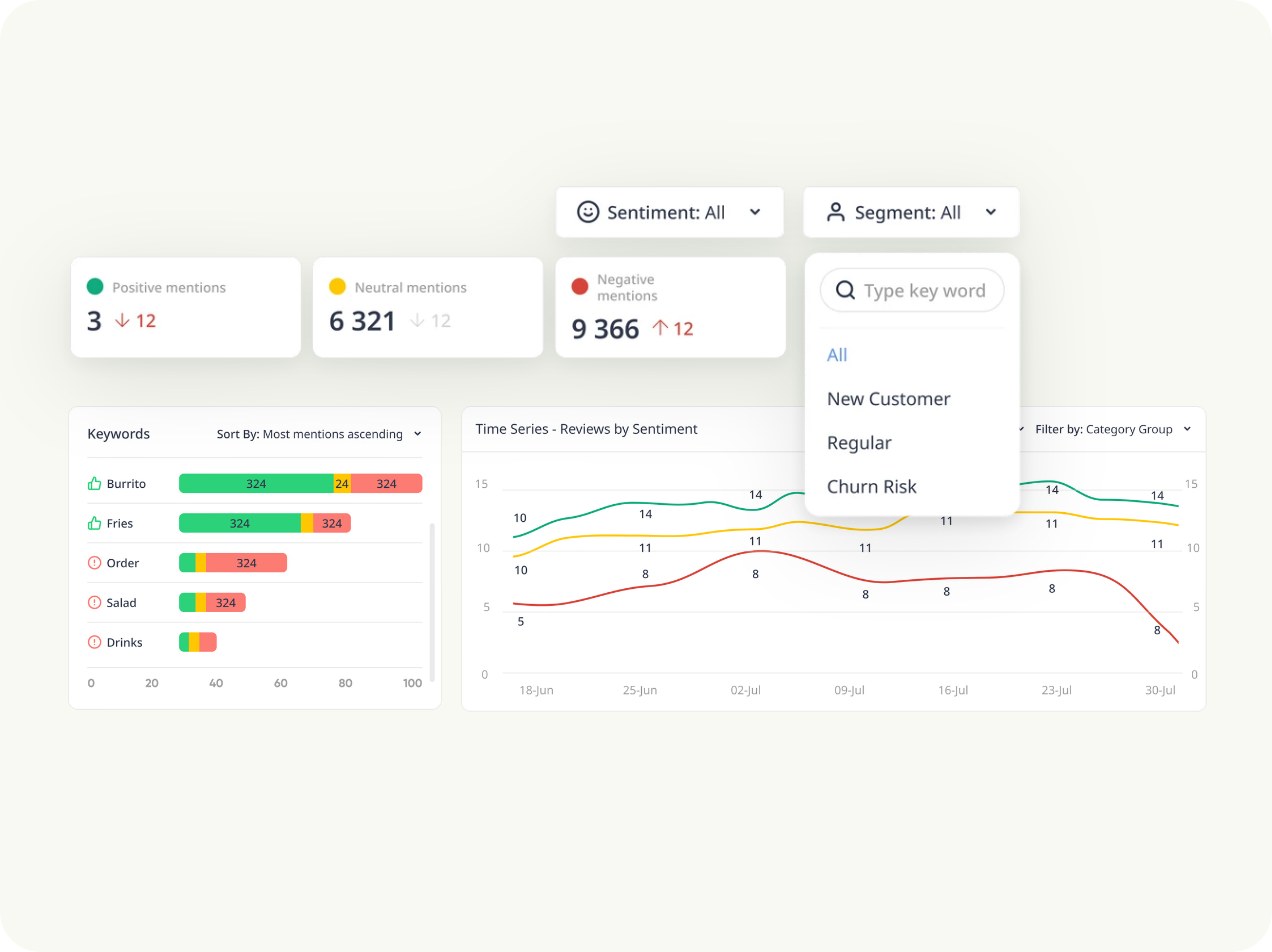
Topic sentiment also helps teams prioritize replies. Reviews with strongly negative mentions of food safety or staff behavior usually deserve a fast, personal negative review response and a follow-up with the guest.
At the brand level, Momos operational insights group reviews by topic and location so regional managers can see patterns across stores.
The Condado Tacos case study shows how one brand built chain-wide guest intelligence from its feedback.
Limitations of review sentiment
- Small samples swing. A location with 40 reviews a month can move several points by chance, which is why the calculator above shows a margin of error.
- Classification errors. Sarcasm, very short reviews and slang still trip up even good models, so a regular spot-check of misclassified reviews keeps the numbers honest.
- Who writes reviews. Reviewers are a self-selected group, and very happy or very unhappy guests are more likely to post, so review sentiment describes reviewers more than every guest.
- Platform mix. A month with more delivery reviews can lower food sentiment without any change in the kitchen.
- Definitions vary. Tools treat mixed and neutral reviews differently, which makes comparisons between providers unreliable.
- Topic overlap. A slow kitchen shows up under both wait time and service, so topics are best read together.
How to improve review sentiment
Fix the topic with the most negative mentions per 100 reviews first. Combining how negative a topic is with how often it comes up points you to the change that will affect the most guests.
Share the trend with the people who can act on it. Location managers tend to respond quickly when they see their own topic sentiment each week next to the brand average. Momos's guide to understanding analytics shows how this reporting is set up.
Test changes and watch the next period. If you add a host on Friday nights to cut waits, the wait-time negative share for Friday reviews tells you whether it worked. The calculator above helps you judge whether the change is real.
Close the loop with guests. Replying to negative reviews and contacting guests with serious complaints won't change what they already wrote. It does give you a chance to win them back, and it shows future readers that problems get fixed, which supports your guest experience program.
Spread what works. When one location's service sentiment is consistently strong, the habits of that team are worth documenting and sharing with others as part of operational excellence across the brand.
Best review sentiment tools
The most useful review sentiment tools read reviews from every platform you appear on, recognize restaurant topics accurately, and report by location and period. It also helps when the analysis sits next to the inbox where your team replies, so a negative trend leads straight to the reviews behind it.
| Tool | Best known for |
|---|---|
 MomosBest pick | Guest AI for multi-location restaurants. Reviews from Google, reservation and delivery platforms arrive in one Unified Inbox, AI categorization sorts them by topic and sentiment, and reporting compares every location in one dashboard alongside AI replies and recovery offers. |
 Chatmeter | Local brand reputation management with review and sentiment analytics for multi-location brands |
 ReviewTrackers | Review monitoring and analytics across review sites, now part of InMoment |
 Medallia | Enterprise experience management with text analytics across surveys, reviews and contact center feedback |
 Birdeye | Reviews, listings and customer messaging for multi-location businesses |
 Reputation | Enterprise reputation management across reviews, listings and social media (formerly Reputation.com) |
Each tool classifies reviews slightly differently, so testing two or three on a sample of your own reviews, and checking how they label your topics, is a worthwhile step before deciding.
Common review sentiment mistakes
- Reporting only the overall split. Without topics, review sentiment rarely shows which part of the business needs attention.
- Ignoring volume. A topic that's 50% negative but mentioned in 2% of reviews matters less than one that's 25% negative and mentioned in half of them.
- Reacting to noise. Small locations and short periods produce large swings, so checking the margin of error before acting saves wasted effort.
- Changing the topic list often. New definitions break your trend lines and make last quarter's numbers incomparable.
- Mixing platforms without labels. Delivery, Google and booking reviews come from different situations, and blending them hides where a change came from.
- Treating the score as the goal. Review sentiment points you to what guests experience, and the improvement comes from the operational change behind it.
History of review sentiment
Restaurants have always read their reviews, but measuring their sentiment at scale only became practical once reviews moved online and computers could read them. Academic work on classifying opinions in review text took off in the early 2000s, as the sentiment analysis entry describes.
Researchers also showed why the star rating alone was not enough. In "Overcoming the J-shaped distribution of product reviews" (Communications of the ACM, 2009), Nan Hu, Paul Pavlou and Jie Zhang described how online ratings pile up at the top of the scale with a smaller bump at the bottom, which leaves the average with little detail to offer.
Restaurant reviews then became a standard test case for topic-level sentiment. The SemEval-2014 aspect-based sentiment task, organized by Maria Pontiki and colleagues, used restaurant reviews labeled with categories such as food, service, price and ambience, the same topics operators care about.
The commercial case grew alongside the research. Michael Luca's 2011 Harvard Business School working paper "Reviews, Reputation, and Revenue: The Case of Yelp.com" found that a one-star increase in a Seattle restaurant's Yelp rating was associated with a 5% to 9% increase in revenue for independent restaurants.
Reputation platforms began reporting the share of positive and negative reviews alongside ratings in the 2010s. Large language models have since made topic-level review sentiment accurate and affordable enough for brands to track it at every location, every week.
Frequently asked questions
What is review sentiment?
Review sentiment is a measure of how guests feel in the reviews they write about your restaurant. It's usually reported as the percentage of reviews, or of topic mentions, that are positive, neutral and negative. Most brands track it by topic, location and month.
How is review sentiment different from sentiment analysis?
Sentiment analysis is the technique, the AI that reads each review and labels the feeling in it. Review sentiment is the measure you get when you count those labels across your reviews and track them over time. The sentiment analysis entry in this glossary explains how the classification itself works.
How do you calculate review sentiment?
Divide the number of positive reviews by the number of reviews analyzed and multiply by 100, then do the same for neutral and negative reviews. For a topic such as wait time, divide the negative mentions of that topic by all mentions of it. If 54 of 75 wait-time mentions are negative, wait-time sentiment is 72% negative.
Can a restaurant have a high star rating and poor review sentiment?
Yes, on specific topics. A location can average 4.5 stars while guests complain about parking or wait times inside otherwise happy reviews. Topic-level sentiment catches these complaints early, before they become frequent enough to pull the rating down.
What is a good review sentiment score?
No independent body publishes a restaurant benchmark for review sentiment, and tools classify reviews in slightly different ways. The most reliable comparisons are your own trend over time and the gap between your locations, measured with the same tool and method.
How often should you review sentiment by location?
Monthly reporting suits most brands, with a weekly view for busy locations. A small location may receive too few reviews in a week for its percentages to mean much, so a rolling 30- or 90-day window keeps the numbers stable.
How many reviews do you need for review sentiment to be reliable?
More is always better, because small samples swing widely. With 50 reviews, a single review moves a percentage by 2 points. With a few hundred reviews per period, changes of several points start to reflect real shifts, which the calculator on this page helps you check.