42 Most Important Restaurant Performance Metrics To Measure
Vincent Nguyen

Running a restaurant leaves little margin for error. Fierce competition, razor-thin margins, and shifting customer habits mean most restaurants don't survive past their fifth year.
The ones that do survive are the ones that track the right numbers.
In this article, we break down the essential restaurant performance metrics across four categories: financial, operational, performance, and customer, so you always know where your business stands and where to push next.
Restaurant Performance Metrics By Category
We'll cover 4 types of performance metrics in this article:
Financial metrics: you can use these to track the money flowing in and out of your restaurant, from revenue and profit margins to cost of goods sold and labor spend.
Operational metrics: you can use these to measure how well your day-to-day systems are running, including table turnover, order accuracy, and kitchen throughput.
Efficiency metrics: use these to show how effectively you are converting inputs like time, labor, and ingredients into output, helping you spot waste and streamline processes.
Customer metrics: use these to measure the guest experience through satisfaction scores, repeat visit rates, online reviews, and loyalty indicators.
Financial Performance Metrics For Restaurants
Here are the financial performance metrics for restaurants:
1. Revenue per available seat hour (RevPASH)
RevPASH tells you how much revenue you are squeezing out of each seat for every hour your restaurant is open.
It blends pricing, occupancy, and turnover into one number, so you can see how efficiently you are using your physical space, not just how much you sold.
Say your dinner RevPASH is twice your lunch RevPASH. That gap tells you lunch is underperforming relative to your fixed seating capacity, and you might address it with a lunch special, a faster menu, or a different staffing plan for that period.
2. Gross profit margin
Gross profit margin shows you how much of every dollar in sales is left after covering the cost of the food and drinks you sold.
It is the first number you check when you want to know if your pricing and sourcing are working before labor and rent even enter the picture.
If you notice your gross margin slipping even though sales look steady, it usually means your supplier costs have crept up or your portions have gotten a little generous over time, and it is worth checking your recipe costs against current invoice prices.
3. Net profit margin
Net profit margin is your true bottom line.
After food, labor, rent, utilities, and everything else is paid, this is what is actually left over for you as profit from every dollar of sales.
Most full service restaurants run net margins between 3 and 9 percent, so if yours dips below that, even a small jump in one expense category, like a utility rate hike or a new hire, can be the difference between a profitable month and a loss.
4. Food cost percentage
Food cost percentage tells you what share of your food sales is being eaten up by the cost of ingredients.
You will want to watch this closely because it reacts fast to waste, theft, over portioning, and supplier price changes.
A healthy range is typically 28 to 35 percent. If your actual food cost, calculated from real purchases and inventory counts, runs noticeably higher than your theoretical food cost based on recipes, that gap is usually waste, shrinkage, or inconsistent portioning in the kitchen.
5. Beverage cost percentage
Beverage cost percentage works the same way as food cost, but for drinks.
Because beverages, especially alcohol, usually cost much less relative to what you charge, this is often where you will find your biggest margin opportunity.
If your bar program is well run, you can often keep this in the high teens to low 20s, well below food cost. So if you are looking for a quick win on margins, reviewing pour sizes and drink pricing is usually faster than overhauling the kitchen.
6. Prime cost ratio
Prime cost combines your two biggest controllable expenses, food and labor, into a single number.
Many operators treat this as the most important figure to watch because it captures the bulk of your variable costs in one view.
Most operators aim for prime cost between 55 and 65 percent of sales. If yours climbs above that, you will want to figure out whether food cost, labor cost, or both are driving it, since the fix looks different depending on which one it is.
7. Labor cost percentage
Labor cost percentage shows you how much of your revenue goes toward your team, including wages, benefits, and payroll taxes.
It reflects both how efficiently you are staffed and how well your schedules match actual demand.
Typical targets fall between 25 and 35 percent, depending on your service style. If you run a full service restaurant, expect this to sit higher than a quick service concept simply because of front of house staffing needs.
8. Average check size
Average check size is what each guest, or each table, typically spends on a visit.
It reflects your menu pricing, your portion strategy, and how well your team encourages extras like appetizers, drinks, and desserts.
If you see your average check rising while your cover count stays flat, that is usually a sign your upsell training is working, rather than just a result of a price increase. Try segmenting this by party size too, since a table of two and a table of six behave very differently.
9. Sales per labor hour
Sales per labor hour tells you how much revenue you are generating for every hour of paid staff time.
It gives you a direct read on staffing efficiency, which is useful when you are deciding whether to add or cut a shift.
If you notice a high labor cost percentage alongside low sales per labor hour, you are likely overstaffed for the demand you are seeing. The reverse, low labor cost but strained service, often means you need to add hands during that shift.
10. Break even point
Your break even point is the revenue level where your income exactly covers your costs, both fixed and variable.
Fixed costs include things like rent and insurance, while variable costs cover food and hourly labor. Below this point, you are operating at a loss.
Say your rent goes up or you add a new manager position. Recalculating your break even point right away will tell you how much more you need to sell each month just to stay where you were before, which helps you set realistic targets going forward.
11. Controllable expenses ratio
Controllable expenses are the costs you can directly influence day to day, things like labor scheduling, food waste, supplies, and utilities usage.
This ratio separates those costs from fixed obligations like rent that you cannot easily change.
If you run multiple locations, this ratio is a fairer way to compare how well each one is managed, since two locations with identical rent and lease terms can still post very different controllable expense ratios depending on how tightly they are run.
12. EBITDA margin
EBITDA stands for earnings before interest, taxes, depreciation, and amortization.
EBITDA margin strips out financing structure and accounting choices to show you the underlying operating profitability of your business.
If you are comparing locations that carry different debt loads or lease terms, or you are evaluating an acquisition, EBITDA margin levels the playing field so you can focus purely on how well each location actually operates.

Operational Performance Metrics For Restaurants
Here are the operational performance metrics for restaurants:
13. Table turnover rate
Table turnover rate tells you how many times you seat a new party at the same table during a service period.
It is one of the clearest signals of how well your floor is flowing, since each extra turn on a table is more revenue from the same physical space.
Say a four top turns twice on a Friday night but three times on Saturday. That difference points to something slowing Friday down, maybe a kitchen backup, a slow server section, or guests lingering, and it gives you a specific place to look.
14. Average dining duration
Average dining duration is how long a party occupies a table from the moment they sit down to the moment they leave.
It sits directly behind your turnover rate, so understanding it helps you see whether slow turns come from the guest experience or from gaps in your service flow.
If your duration is creeping up without check sizes growing, guests are staying longer but not spending more. You might tighten the gap between courses or clear and reset tables faster to free up seats during your busiest windows.
15. Seat occupancy rate
Seat occupancy rate is the share of your available seats that are actually filled during a given service period.
It shows you how close you are running to capacity, which is useful for spotting both wasted seats and the points where you are turning guests away.
If your occupancy sits at 60 percent on weeknights, you have room to fill, and that is a signal to push reservations, promotions, or walk-in traffic toward those slower evenings rather than your already-packed weekends.
16. Waste percentage
Waste percentage is the value of food you throw away, from spoilage, over prepping, or mistakes, measured against your total food cost.
It is a fast, honest read on how tightly your kitchen is running, because waste eats straight into the margin you worked to build everywhere else.
If you log waste for two weeks and find one prep item shows up again and again, that is your starting point. You might adjust par levels, change how far ahead you prep it, or rework the recipe to use the trim.
17. Inventory turnover rate
Inventory turnover rate shows you how many times you use up and replace your stock over a period.
It tells you whether your ordering matches your actual usage, since stock that sits too long ties up cash and creeps toward spoilage.
A low turnover number usually means you are over ordering or holding too much on hand. If your dry goods turn far slower than your produce, that is a sign to trim order sizes and free up the cash sitting on your shelves.
18. Order accuracy rate
Order accuracy rate is the share of orders that go out exactly as the guest asked for them.
It is a front line measure of how well your kitchen and service team are working together, and it has a direct line to guest satisfaction and refunds.
If accuracy dips during your busiest shifts, the pressure is exposing a gap, maybe in how tickets are read, how modifiers are entered, or how dishes are checked before they leave the pass. That tells you where to tighten the process.
19. Ticket time
Ticket time is the average time from when an order is placed to when the food reaches the table.
It is one of the biggest drivers of how fast a guest feels your service is, and it feeds directly into your table turnover.
If your average ticket time jumps on Saturday nights, that is the kitchen telling you it is hitting a ceiling. You might prep more ahead, add a hand on the line, or simplify the menu during peak hours to keep tickets moving.
20. Staff turnover rate
Staff turnover rate is the share of your team that leaves within a year.
It matters far beyond hiring, since every departure carries the cost of recruiting, training, and the dip in service quality while a new person comes up to speed.
If your turnover spikes in one role or one location, that is worth digging into. It often points to a scheduling problem, a management issue, or pay that has fallen behind the market, and fixing it is almost always cheaper than constantly rehiring.
21. Absenteeism rate
Absenteeism rate is how often staff miss scheduled shifts without planning for it ahead of time.
It is an early warning light for team morale and scheduling reliability, since rising no-shows usually surface before bigger staffing problems do.
If absences cluster around certain shifts or certain people, that pattern is telling you something. It might be burnout from back to back closes, an unpopular shift, or a scheduling conflict you can solve before it costs you a short-staffed night.
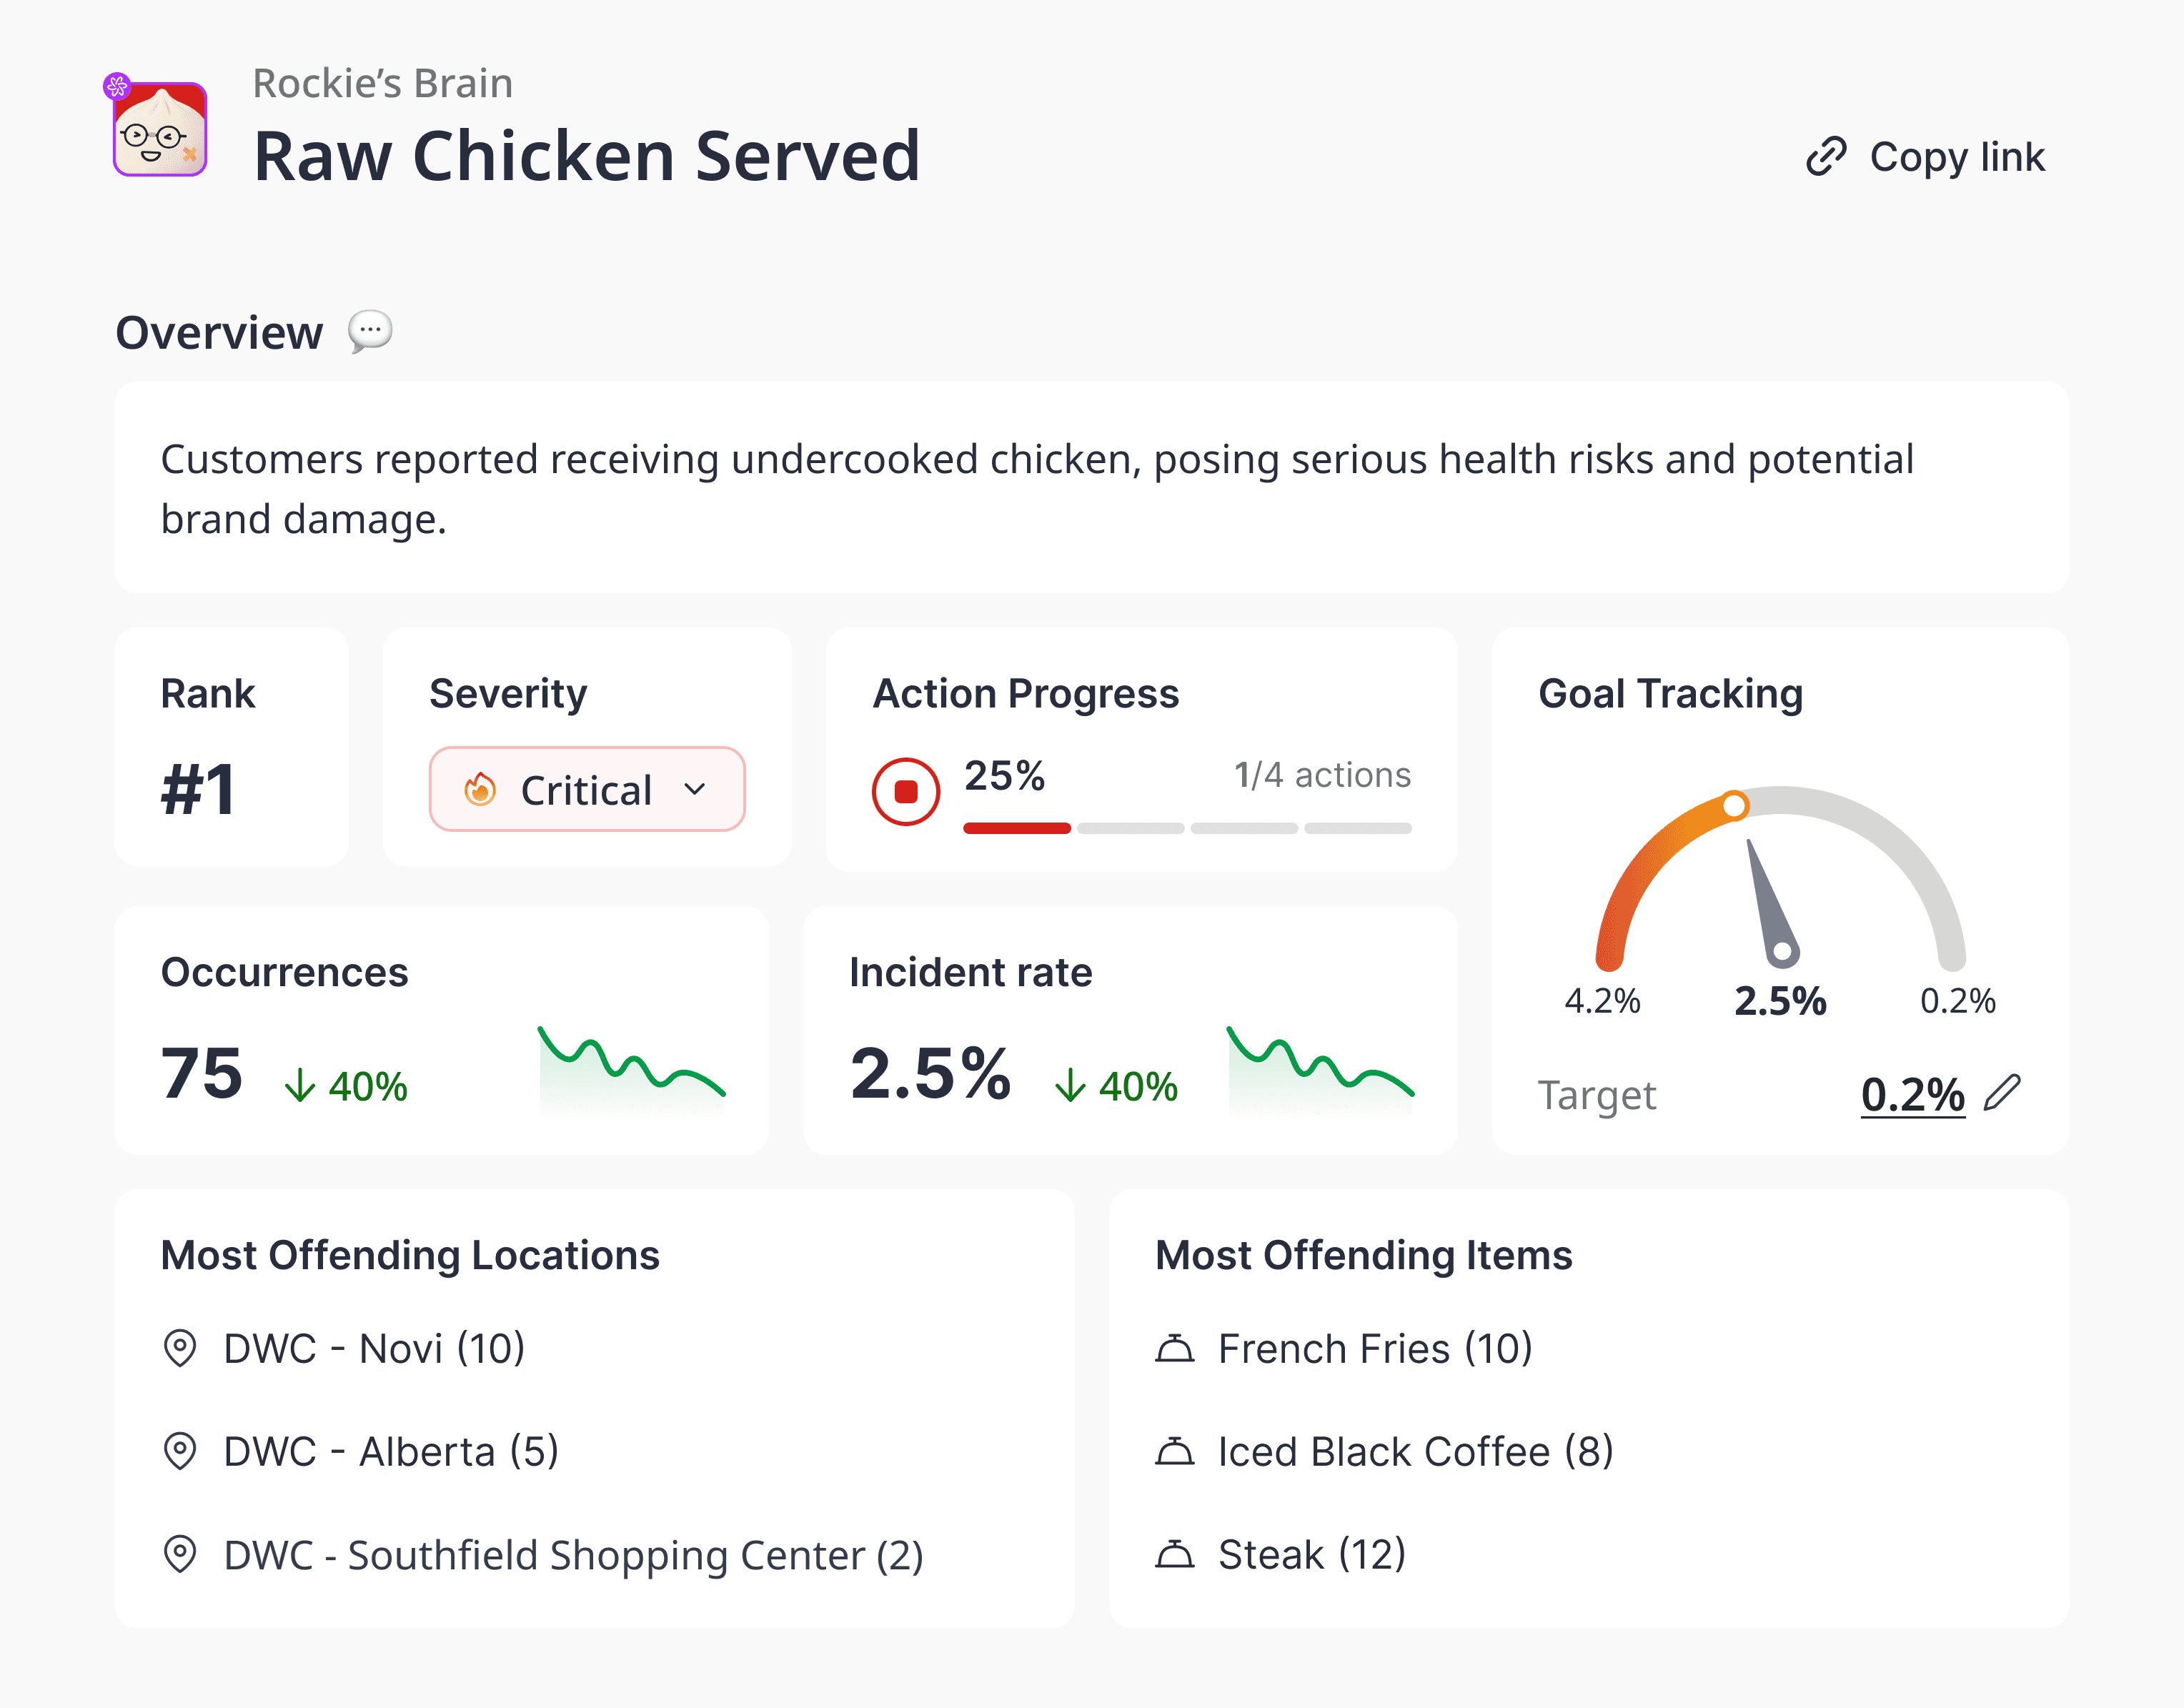
22. Food safety compliance score
Food safety compliance score is the result of internal or third party audits that check how well you follow food handling and hygiene standards.
It protects both your guests and your license, since a single serious lapse can mean closures, fines, or lasting reputation damage.
If the same items keep losing points across audits, like holding temperatures or labeling, that is your training priority. Running quick internal checks between official audits keeps small slips from becoming the finding that shuts you down.
23. Online order fulfillment rate
Online order fulfillment rate is the share of digital orders you complete on time and in full, with no cancellations or errors.
As more of your revenue moves to apps and online ordering, this becomes one of the clearest measures of whether your operation can handle that channel cleanly.
If your fulfillment rate drops when dine-in is busy, your kitchen is being forced to choose between the two. That is a signal to add a dedicated digital prep station or stagger how online orders hit the line during peak hours.
24. Delivery time accuracy
Delivery time accuracy is how often your delivery orders arrive inside the time window you promised.
It carries real weight because third party platforms rank and reward restaurants partly on this, and late deliveries quietly erode your ratings and repeat orders.
If accuracy falls off during dinner rush, the bottleneck is usually prep timing rather than the driver. Tightening when you mark an order ready, so it is picked up hot and on schedule, often does more than blaming the delivery side.
Efficiency Metrics For Restaurants
These metrics measure how well the restaurant converts its capacity, menu, and channels into sales. They sit one level above raw operations: instead of asking "is the kitchen running smoothly," they ask "are we growing, and are we getting the most revenue out of what we have."
25. Same store sales growth
Same store sales growth measures revenue change at your established locations, leaving out any new openings.
It is the cleanest read on organic growth, because it shows whether your existing restaurants are actually getting stronger rather than just adding more locations to the total.
If you opened two new locations this year and your total revenue is up but same store sales are flat, that tells you the growth is coming from expansion, not from your core business improving. That is a very different story to take to investors or a landlord.
26. Sales per square foot
Sales per square foot is your total revenue divided by your usable floor area.
It benchmarks how hard your space is working, which helps you compare locations of different sizes on equal footing and spot where layout might be holding you back.
If a smaller location quietly outperforms a larger one on this number, the bigger space may be carrying dead square footage. That is a prompt to rethink the layout, add covers, or build out a takeaway counter to put that area to work.
27. Menu item profitability
Menu item profitability is the contribution margin each dish brings in, which is its price minus what it costs to make.
It is the foundation of menu engineering, letting you see which dishes actually carry your profit rather than just which ones sell the most.
You might find a popular dish has a thin margin while a quieter one is highly profitable. That is your cue to feature the profitable dish more prominently, retrain servers to recommend it, and decide whether the popular low-margin item needs a price or recipe adjustment.
28. Menu mix percentage
Menu mix percentage shows you what share of total sales each item or category accounts for over a period.
Paired with item profitability, it tells you not just what is profitable but what is actually moving, so you can see where your real revenue is concentrated.
If three dishes make up half your covers, your kitchen and ordering should be built around them. And if a high-margin item barely registers in the mix, that is an opportunity to reposition it on the menu or train your team to suggest it more often.
29. Upsell rate
Upsell rate is how often your team successfully adds a side, drink, or upgrade to a guest's order.
It is one of the most direct levers you have on check size, since small add-ons across many tables compound into meaningful revenue without any new guests walking in.
If one server's upsell rate is double the rest of the floor, that is a training opportunity hiding in plain sight. Have them share what they say and when they say it, and you can lift the whole team's average check.
30. Covers per server
Covers per server is the average number of guests each floor staff member handles in a shift.
It measures your service capacity and helps you find the balance between running lean and stretching staff so thin that service quality slips.
If covers per server climbs and your guest satisfaction scores start dropping at the same time, you have found your ceiling. That is the point where adding one more server protects the experience instead of just adding cost.
Customer Metrics For Restaurants
These metrics measure how guests feel about you and whether they come back.
31. Net Promoter Score (NPS)
NPS measures how likely guests are to recommend you by sorting them into promoters, passives, and detractors — giving you a single number that is easy to track over time and compare across locations. If it slips after a menu change or price increase, that is an early signal worth acting on before it shows up in sales.
32. Guest satisfaction score (CSAT)
CSAT is a post-visit rating of how happy guests were, usually on a 1 to 5 or 1 to 10 scale. Where NPS measures loyalty, CSAT measures the moment — if dinner scores strong but lunch lags, that gap points you straight at the lunch experience rather than the whole operation.
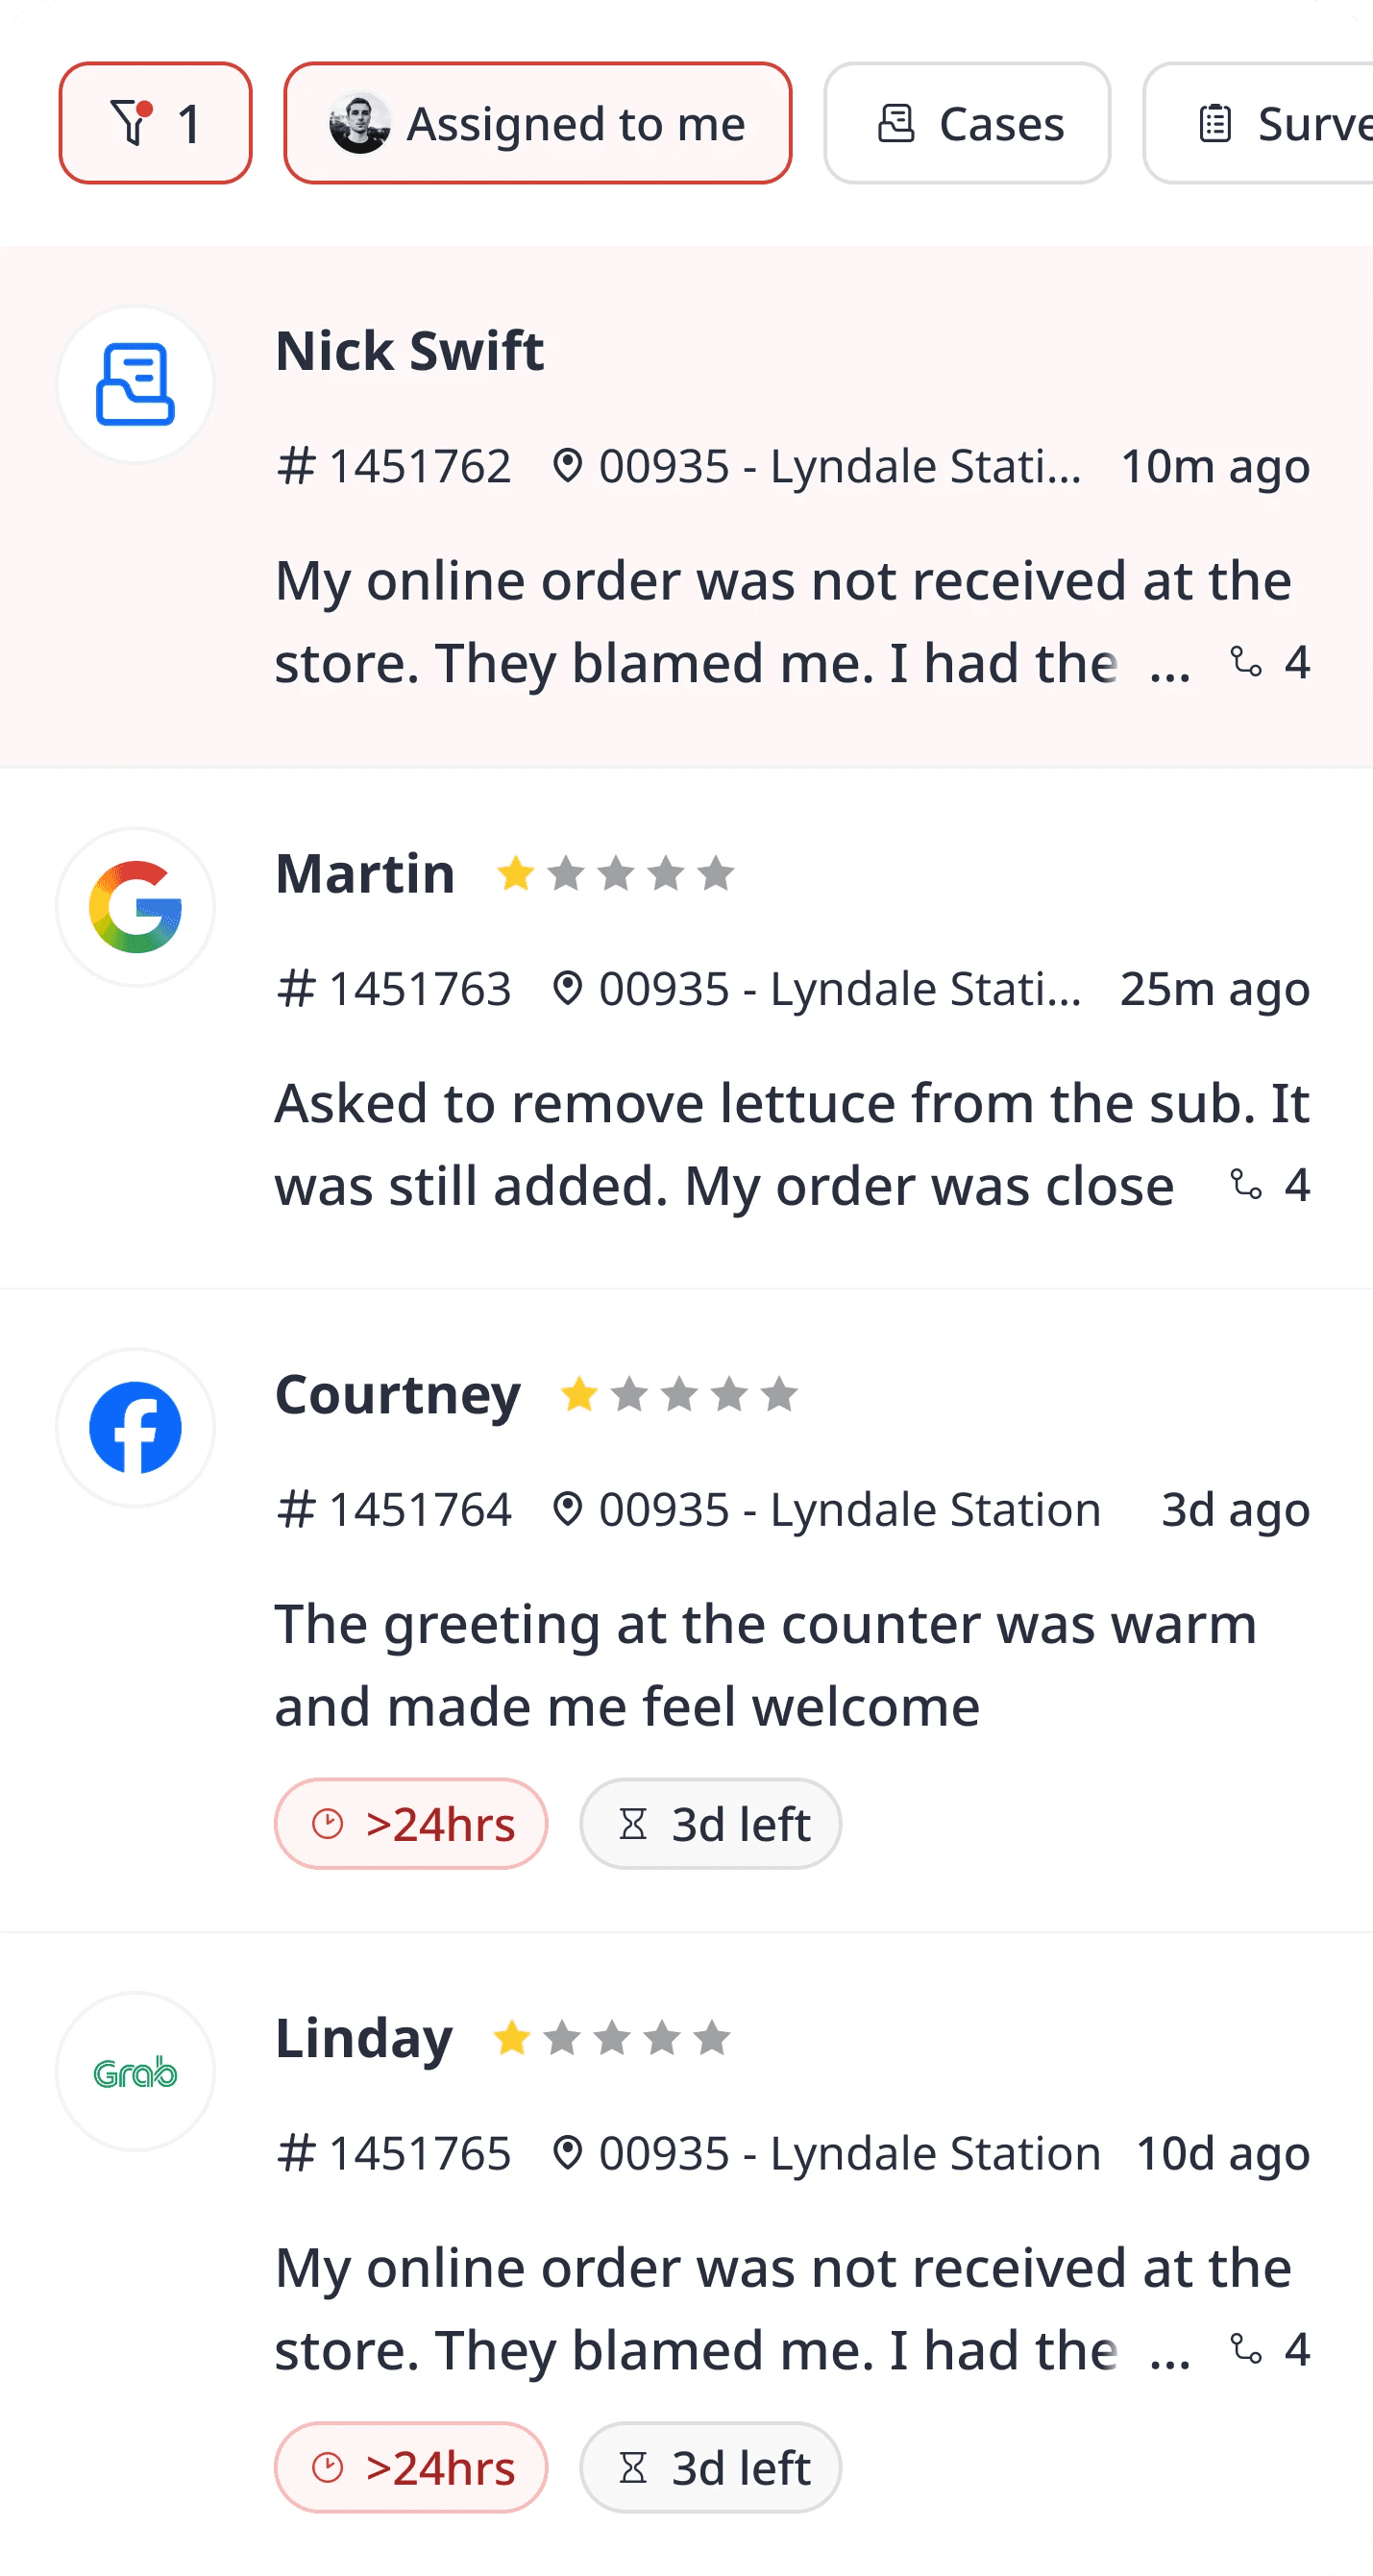
33. Online review rating
Your average star rating across Google, Yelp, TripAdvisor, and delivery platforms is one of the biggest drivers of new guest acquisition. Moving from 4.1 to 4.4 stars can noticeably lift how often you show up in search — steadily encouraging happy guests to leave a review is often the most cost-effective marketing you have.
34. Review response rate
Review response rate is the share of your online reviews — positive and negative — that get a reply from you. Platforms often reward active engagement with better visibility, so if you only respond to complaints, you are missing half the value.
35. Guest sentiment score
Sentiment score uses AI to analyze guest feeling across reviews and surveys, broken down by topic like food, service, ambiance, and value. If your overall rating holds steady but sentiment on service quietly turns negative, that is an early warning a star average would hide.
36. Repeat visit rate
Repeat visit rate is the share of guests who come back within a defined window — the most direct measure of loyalty you have. If the rate is low despite strong satisfaction scores, guests enjoy you but are not being reminded to return, which is exactly where a loyalty program or follow-up offer can help.
37. Customer lifetime value (CLV)
CLV is the total revenue you can expect a guest to generate over the span of their relationship with you. Once you know a regular is worth far more than a single check, comping a dessert to recover a bad night looks like an easy investment rather than a cost.
38. Churn rate
Churn rate is the share of previously active guests who have not come back within the window you would expect. If you can spot regulars who have gone quiet, reaching out with a we-miss-you offer is almost always cheaper than finding a brand new guest.
39. Complaint resolution rate
Complaint resolution rate is the share of guest complaints you actually close out. A guest whose issue is fixed quickly frequently becomes more loyal than one who never had a problem — tracking this makes sure complaints do not slip through during your busiest shifts.
40. Social media engagement rate
Engagement rate measures the likes, comments, shares, and saves your posts earn relative to your follower count. If behind-the-scenes clips or new dish reveals consistently outperform other formats, that is your audience telling you what they want — lean into it to grow reach without spending more on ads.
41. Survey response rate
Survey response rate is the share of guests who complete a post-visit feedback request. If the rate is low, the survey is probably too long or arrives at the wrong moment — trimming it to a few questions and sending it right after the visit gives you a more trustworthy read.
42. Time to first response (reviews)
Time to first response measures how quickly you reply to a new review after it is posted. Replying to a negative review within hours, while the guest is still paying attention, can turn a frustrated visit into a second chance — let it sit for a week and even a thoughtful reply lands flat.
 AI agents automate all guest interactions, 24/7, across all locations of your restaurant.

" transform="translate(3.219 19.212)" width="152.45224485148515px"/><path d="M 0 11.619 C 7.071 11.39 33.491 21.738 40.35 21.268 C 38.499 18.19 37.116 14.915 35.507 11.625 C 33.7 7.867 32.587 3.926 31.702 0" fill="transparent" height="21.28391189647101px" id="I9fuJaf7q" stroke-dasharray="" stroke-linecap="round" stroke-linejoin="round" stroke-width="4.97" stroke="rgb(0, 0, 0)" transform="translate(139.727 55.754)" width="40.34950693069311px"/></svg>)