What is Restaurant Intelligence? How To Collect Data In Your Restaurant?
Vincent Nguyen

Running a restaurant means making dozens of decisions every day, from staffing, menus, purchasing, and guest experience.
They are often made with incomplete information.
When you're operating a single location, you can certainly handle everything just by being present. However, as you scale across multiple locations, that "intuition" stops being reliable, because:
What is Restaurant Intelligence?
Restaurant business intelligence (BI) is the practice of collecting data from across your operation (sales, labor, inventory, guest feedback, and financials) and turning it into information you can act on.
Instead of checking five different systems to understand how your business is performing, BI consolidates everything into a single view that tells you what is happening, why it is happening, and what to do about it.
There is a difference between "reporting" and "intelligence". You may have many, separate reports for sales, inventory, and finance, but none of them talk to each other, and none of them tell you what the numbers mean together.
BI sits above all of these systems and connects the dots.
A Practical Example of Restaurant BI
Say your Friday dinner revenue is down 12% compared to the same period last month.
You know it happened, but do you know why it happened?
With a connected BI system, you might see that the drop correlates with a 20-minute increase in kitchen ticket times on Friday evenings, driven by two items added to the menu six weeks ago that require significantly more prep time.
You'd also see that guest satisfaction scores on Fridays dropped in the same window, with complaints clustering around wait times and food arriving cold.
Meanwhile, your labor data shows that your Friday line is actually overstaffed relative to covers. That means the issue is not headcount, but rather menu complexity slowing down execution.
Without BI, you might have cut staff to reduce costs, which would have made the problem worse. With BI, you identify the two menu items creating the bottleneck, adjust or remove them, and recover the revenue.
That is what separates business intelligence from reporting. Reporting describes the past. Intelligence explains it and points to what to fix next.
Core Areas of Restaurant BI
Anywhere data is being generated, you can use it as an input into your BI system. The more of those inputs you connect, the clearer your picture becomes.
Usually, there are 5 major areas to keep tab on:
| Area | What you can see and do |
|---|---|
Sales and revenue |
You can track revenue by location, daypart, channel, and menu category. This tells you which shifts are underperforming, which items drive margin versus just volume, and how your delivery and dine-in mix is shifting. |
Labor and scheduling |
You can connect your scheduling data to actual cover counts and see your labor cost as a percentage of revenue. This shows you where you are overstaffed, where coverage gaps are hurting service, and where you can trim without affecting output. |
Food cost and inventory |
You can compare your theoretical food cost against what you actually spent. Every variance is money leaving the business. BI helps you catch waste patterns early, flag supplier price increases, and link recipe adherence to cost outcomes. |
Guest experience |
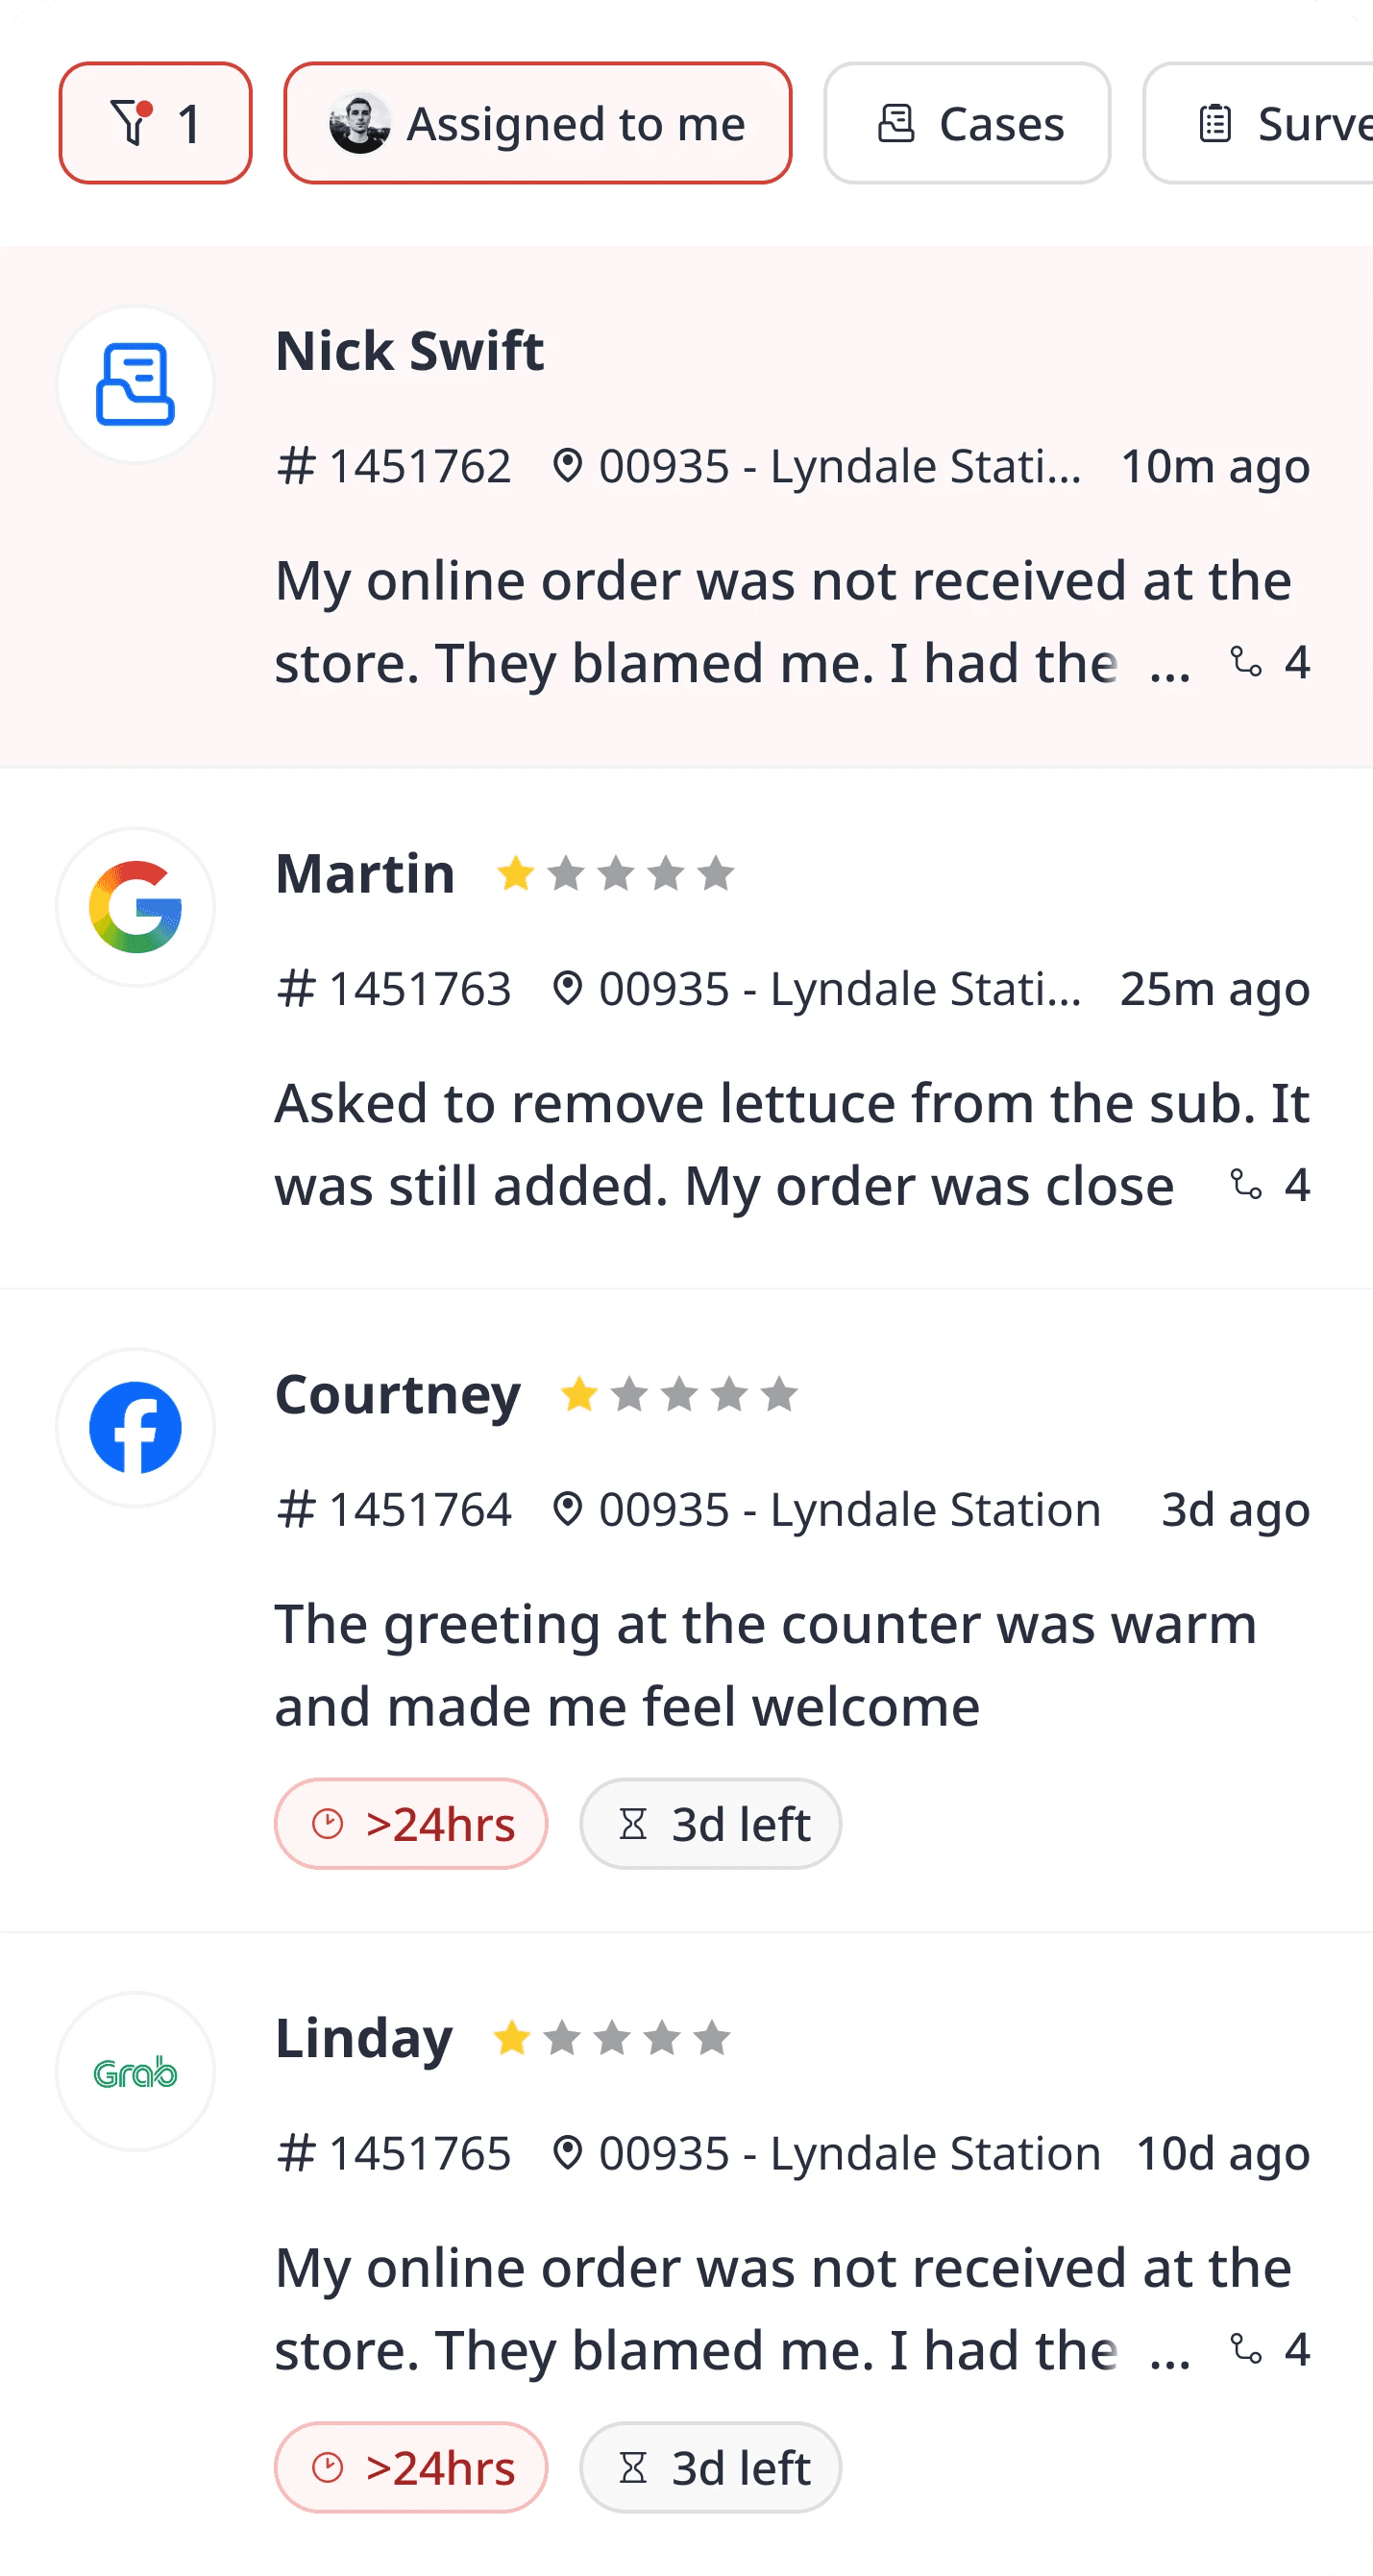
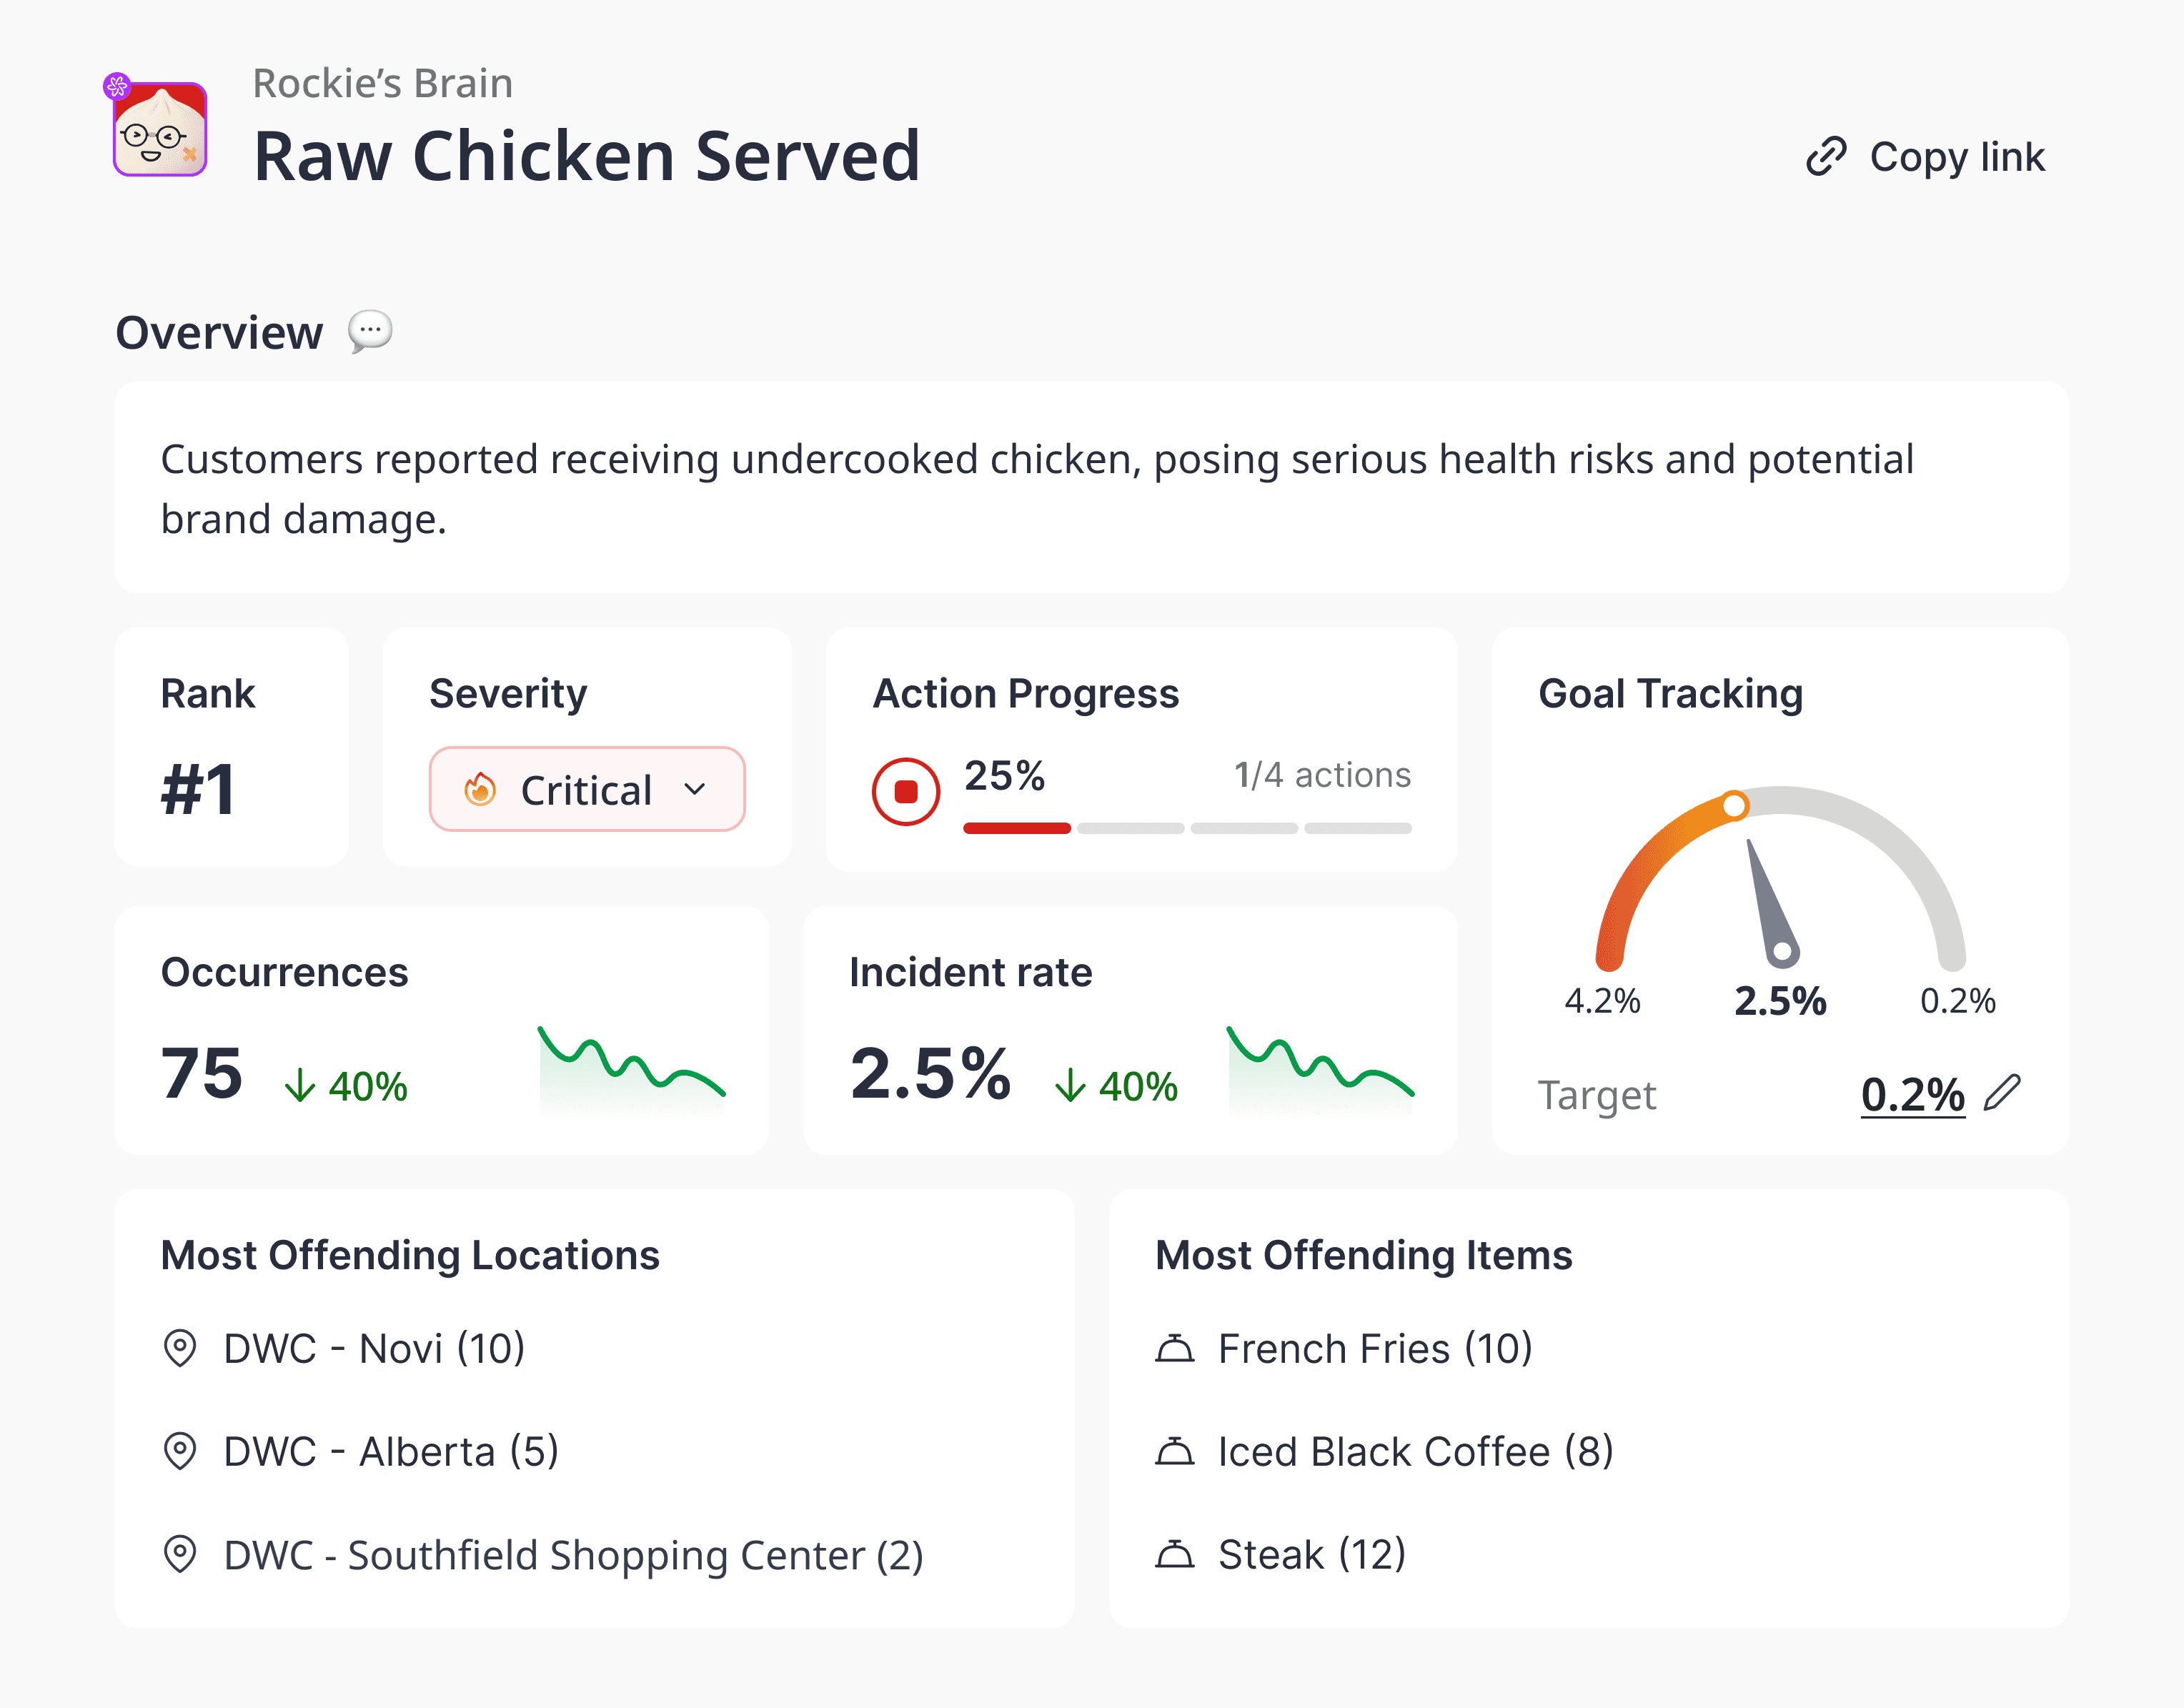
You can pull review scores, complaint themes, CSAT results, and repeat visit rates into one view. Instead of just knowing guests are unhappy, you can see why, at which location, on which days, and tied to which part of the experience. |
Financial health |
You can see prime cost, EBITDA, and P&L across every site in one place. This gives your finance team and ownership a consolidated view of where the business is healthy and where it needs attention. |
Explore further: 42 Restaurant Performance Metrics To Track
How To Gather Business Intelligence in Restaurants?


Papa Murphy's, one of the largest take-and-bake pizza chains in North America, wanted to keep track of customer sentiment across their massive franchise network. With Momos, they centralized review monitoring across every location, surfacing patterns, flagging underperforming stores, and enabling managers to respond faster than ever before.
 AI agents automate all guest interactions, 24/7, across all locations of your restaurant.

" transform="translate(3.219 19.212)" width="152.45224485148515px"/><path d="M 0 11.619 C 7.071 11.39 33.491 21.738 40.35 21.268 C 38.499 18.19 37.116 14.915 35.507 11.625 C 33.7 7.867 32.587 3.926 31.702 0" fill="transparent" height="21.28391189647101px" id="I9fuJaf7q" stroke-dasharray="" stroke-linecap="round" stroke-linejoin="round" stroke-width="4.97" stroke="rgb(0, 0, 0)" transform="translate(139.727 55.754)" width="40.34950693069311px"/></svg>)