Customer Experience
John Lim
See What’s Working at Every Location in One Report On-The-Go
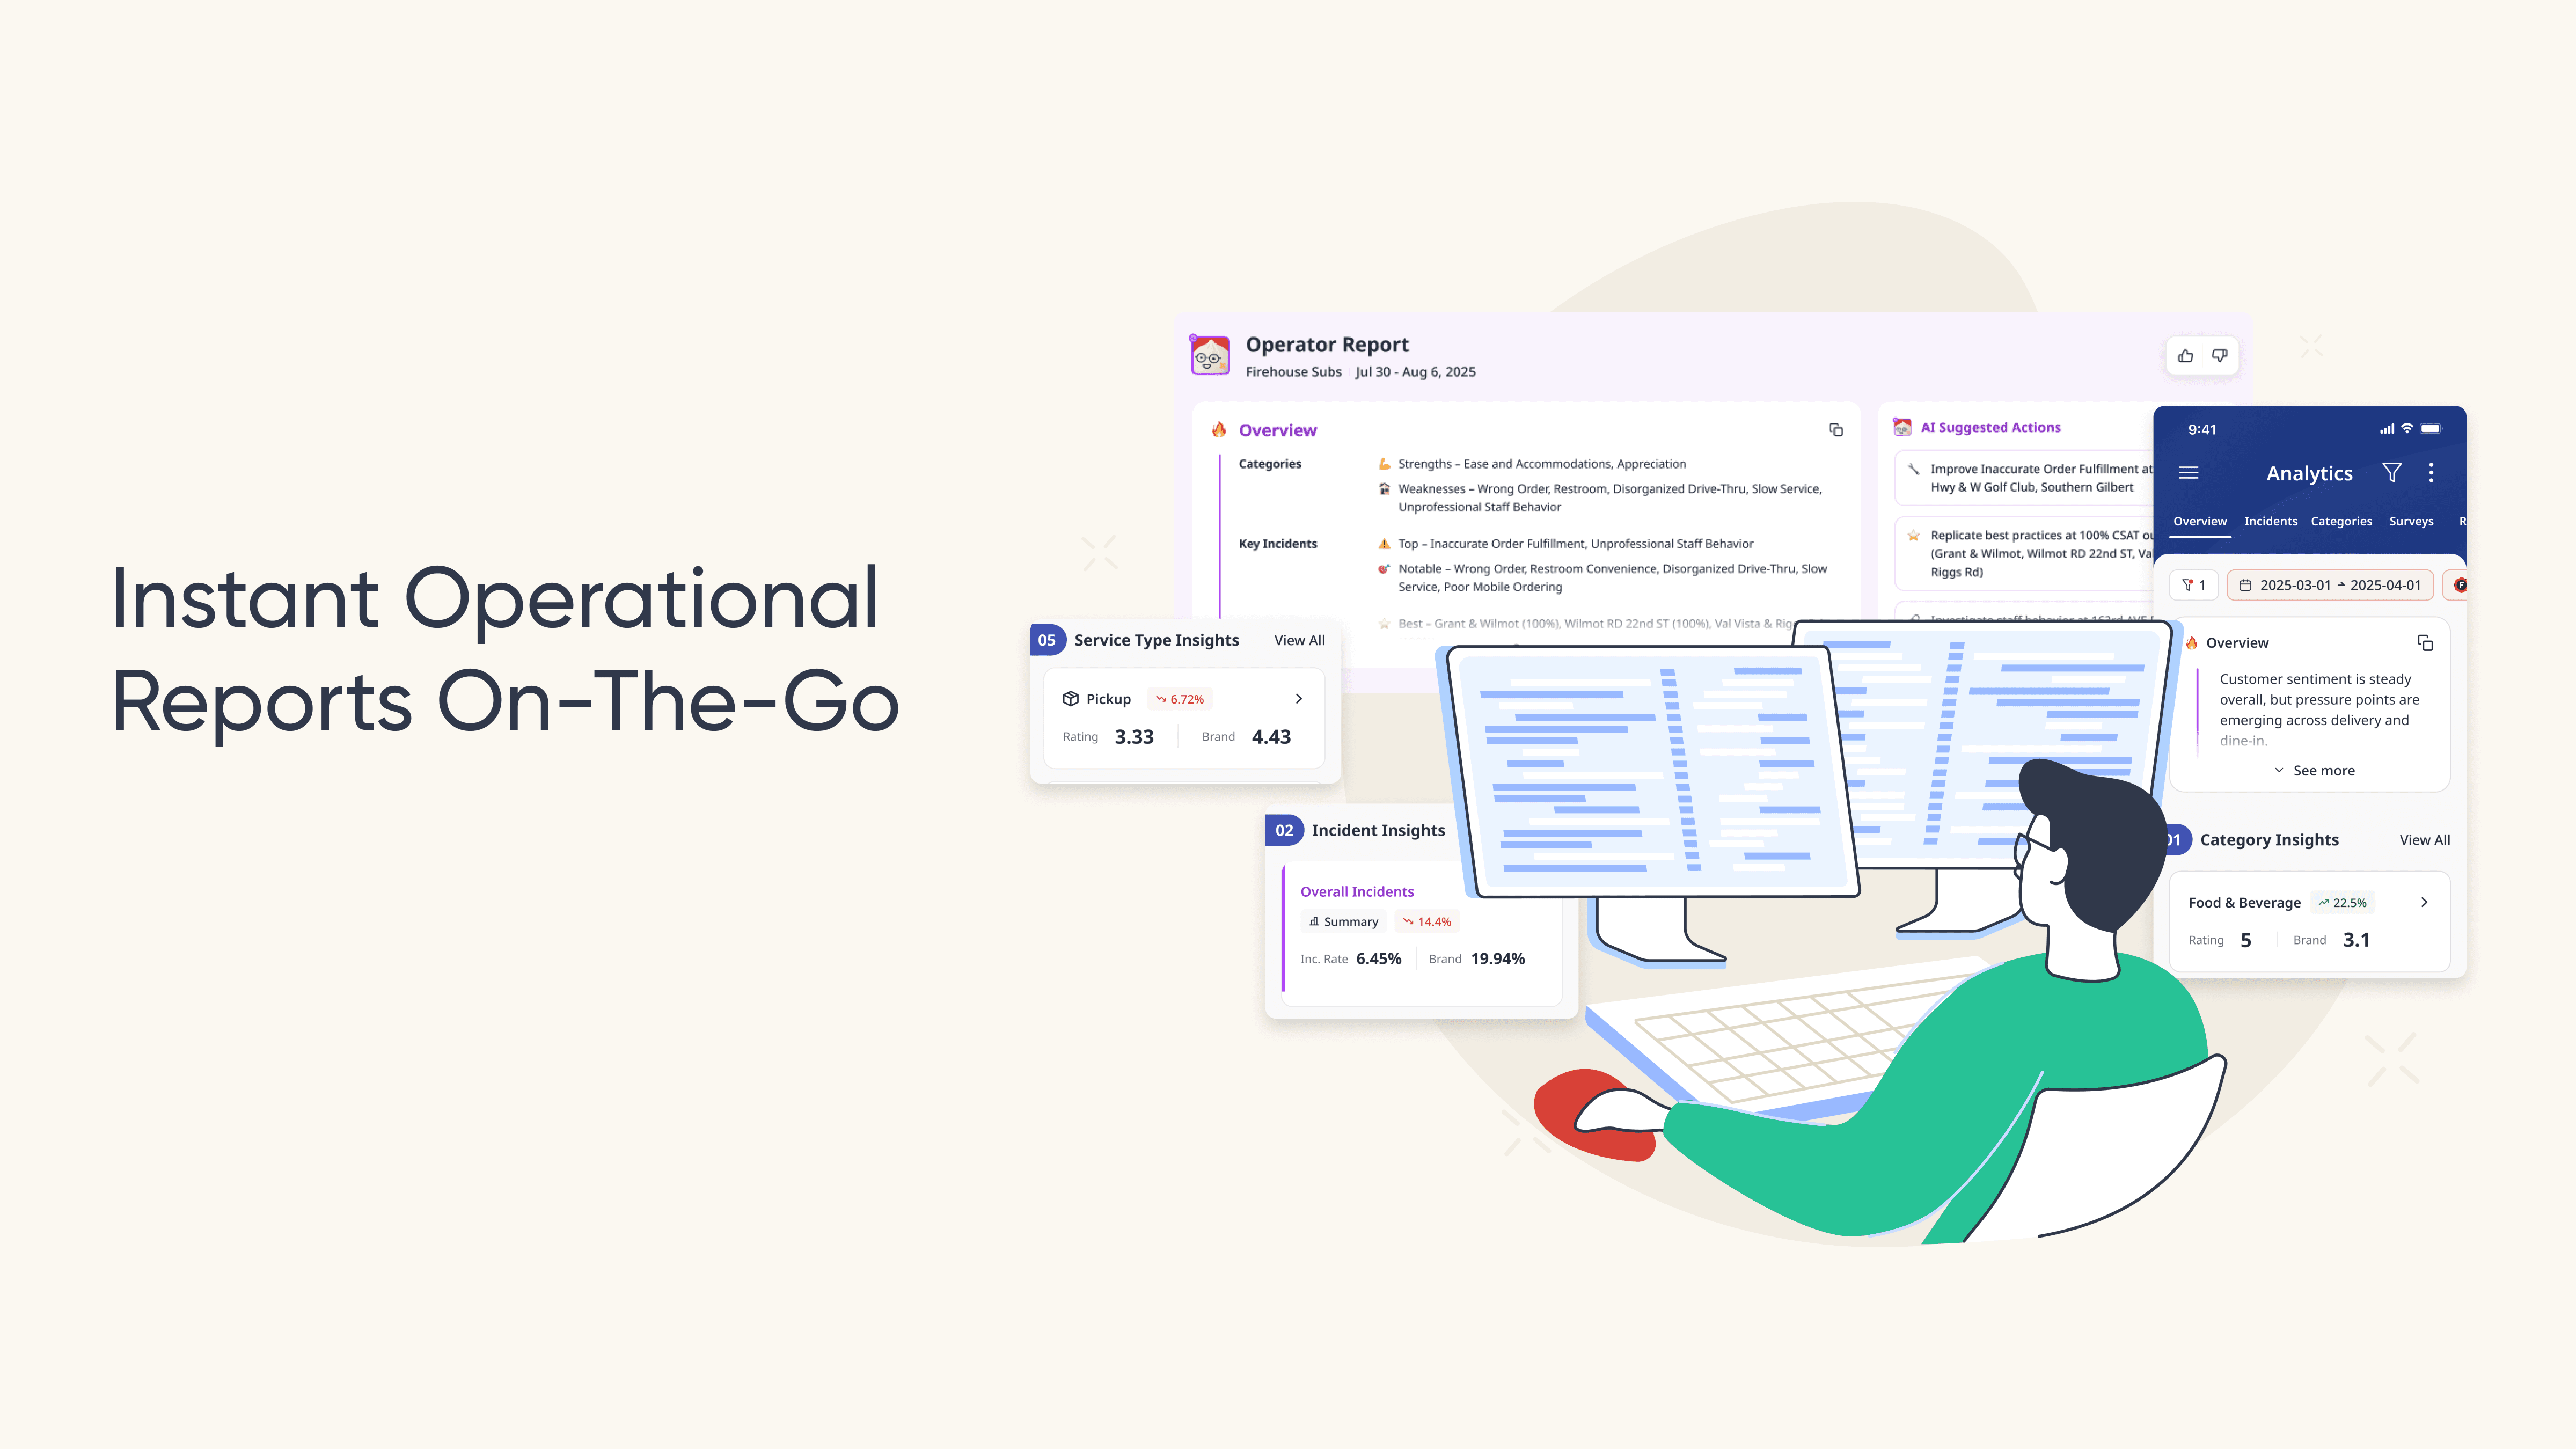
Running a multi-location business means you’re juggling dozens of moving parts. But when reports only show averages across outlets, it’s hard to know which stores are thriving and which need attention. That’s why the new Operator Report exists. It gives every operator a clear snapshot of their most important metrics in one place. By highlighting the important numbers across locations, categories, incidents, service types, and feedback sources, Operator Reports turn complex data into actionable insights that drive real improvements.
Best of all, these reports are now available directly on desktop and in the Momos mobile app, so you can access them anytime, anywhere.
Why this matters
By simplifying and consolidating the most critical information into a weekly and monthly report, we’ve made it easier than ever for operators to focus on their top priorities and act quickly.
Instead of sifting through dashboards, operators can see:
Fix issues on the spot. AI summaries with recommended next steps go directly to your inbox, so operators can resolve problems wherever your business operates.
Spot trends early. Identify incident spikes, CSAT dips, and feedback shifts before they escalate.
Work smarter. Get clear breakdowns by location, service type, and channel—all in one view.
Recover revenue. Fewer incidents. Faster fixes. Happier guests.
How it works (step-by-step)
1. Pick your time frame
Reports are generated after each week or month closes, so you’re working with complete data. Choose which period to view — no custom ranges, just focused, finalized insights.
2. Select your hero metric
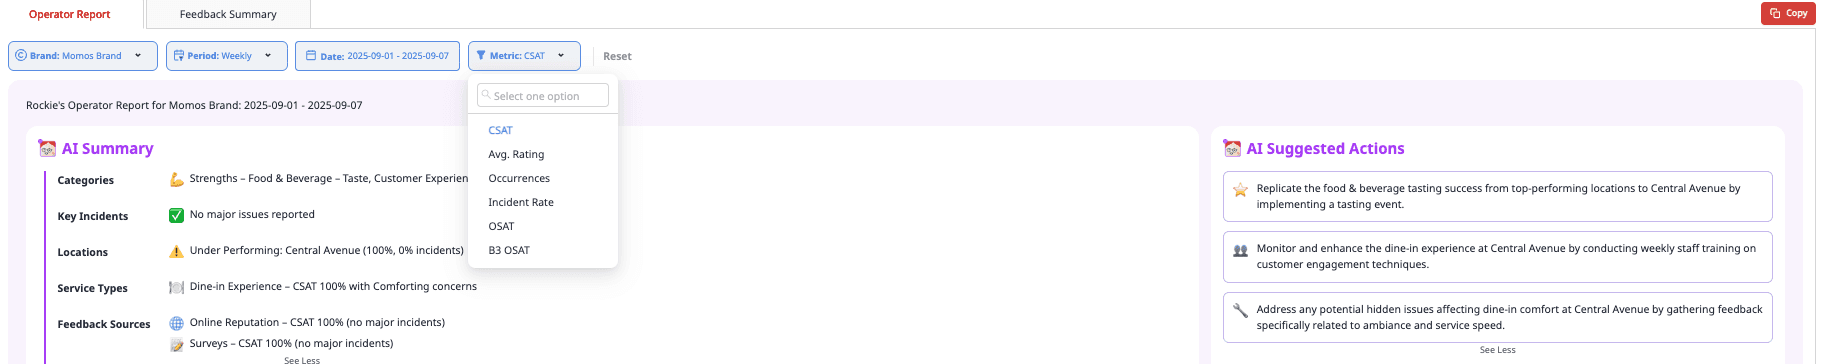
Default is CSAT, but you can switch to rating, occurrences, incident rate, or reply rate depending on your goal.
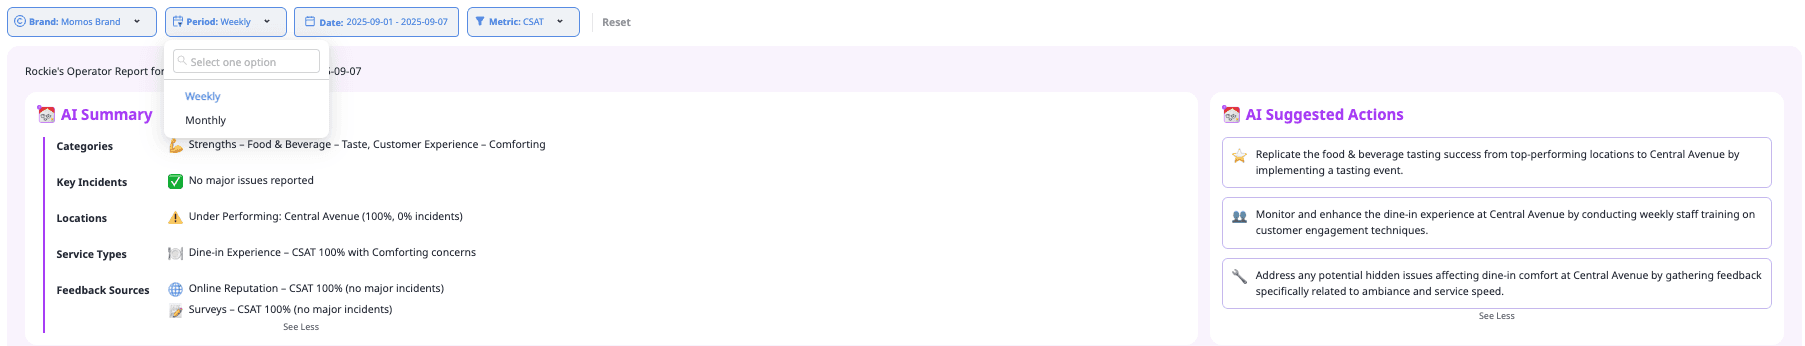
3. Review your AI summary
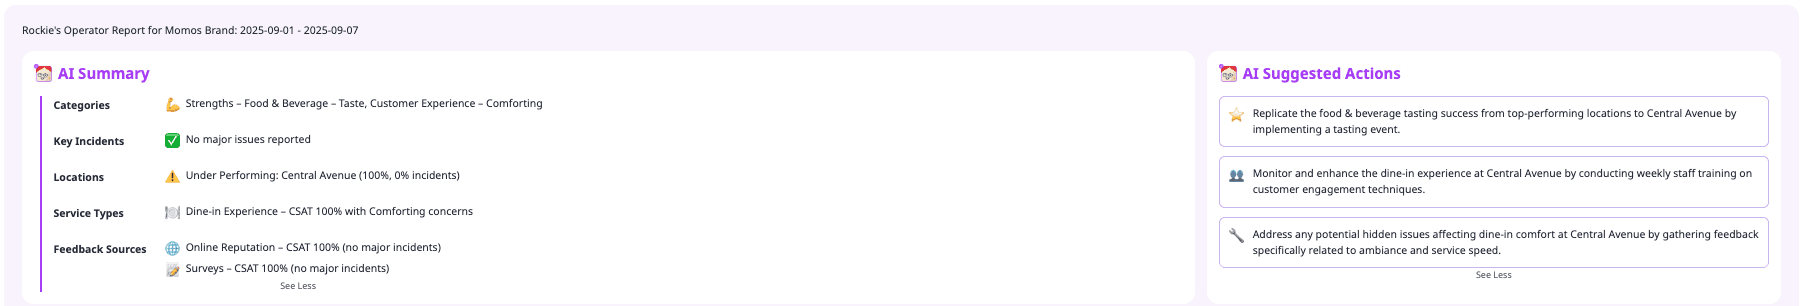
At the top of the report, see a short, plain-language overview of performance:
Categories that are doing good
Reported key incidents
Underperforming locations
Feedback sources
Suggested actions for fixes
... and more
4. Drill into insight cards
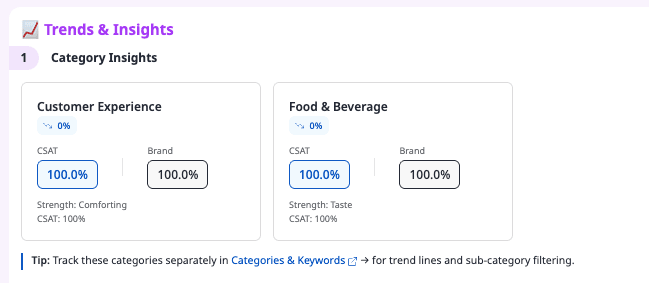
Cards are organized by Category, Incident, Location, Service Type, and Feedback Source. Each shows:
CSAT and Brand performance
Trends over time
5. Take action from the report
Under Tip, get more details, including root cause analysis, affected locations, related customer comments, and recommended actions.
6. Get the report via email or check it on the app
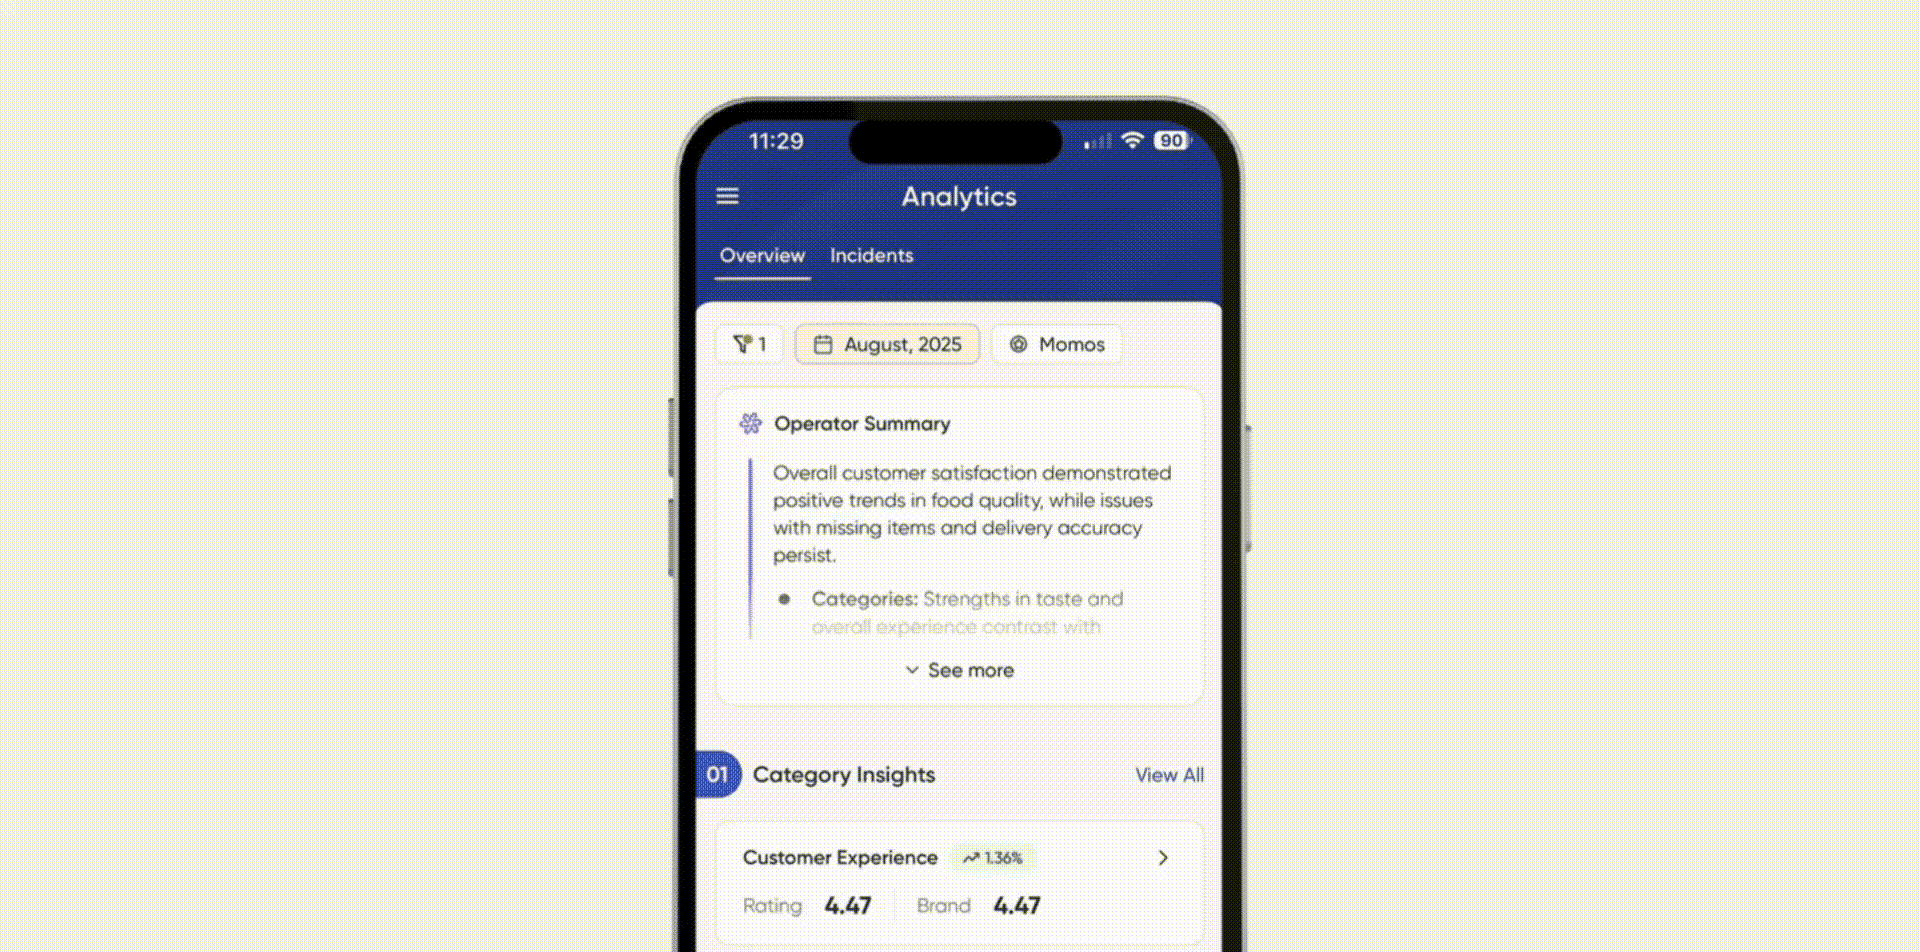
Stay updated no matter where you are, even through the convenience of your smartphone.
Pro tips
Set clear targets in your account settings so scores are always shown against the benchmark you care about.
Highlight wins as well as fixes, sharing top performer practices can lift others faster.
Review patterns monthly to spot systemic issues before they spread.
Ready to create operator reports?
Already a customer? Do it in your dashboard now today.
New to Momos? See how Operator Reports keep every location focused on what matters most. Sign up
Frequently Asked Questions
Can I see live data in Operator Reports?
No. Reports are generated after the week or month closes so the insights are complete.
Can different users see different data?
Yes. Reports respect the user’s permissions, so operators only see their own locations.
Can I change the metrics in the cards?
Yes. You can switch the hero metric for the whole report, and it applies across all insight cards.


" transform="translate(3.219 19.212)" width="152.45224485148515px"/><path d="M 0 11.619 C 7.071 11.39 33.491 21.738 40.35 21.268 C 38.499 18.19 37.116 14.915 35.507 11.625 C 33.7 7.867 32.587 3.926 31.702 0" fill="transparent" height="21.28391189647101px" id="I9fuJaf7q" stroke-dasharray="" stroke-linecap="round" stroke-linejoin="round" stroke-width="4.97" stroke="rgb(0, 0, 0)" transform="translate(139.727 55.754)" width="40.34950693069311px"/></svg>)