Customer Service
John Lim
Understanding Analytics on Momos in Under 5 Minutes

Data doesn’t have to be overwhelming. In fact, you can get the most important takeaways about your business in under five minutes. With Momos Analytics, multi-location operators can see how feedback, recovery, and operations are performing and know exactly where to act next.
The challenge: too much data, too little time
Operators and managers don’t have hours to dig through dashboards. You need quick, reliable signals that show:
How customers are feeling across all locations
Whether recovery efforts are working
Which stores are on track, and which need help
That’s what Momos delivers in a single, easy-to-read view.
The Momos 5-Minute Check
Here’s what you can cover in under five minutes:
1. Operator Report
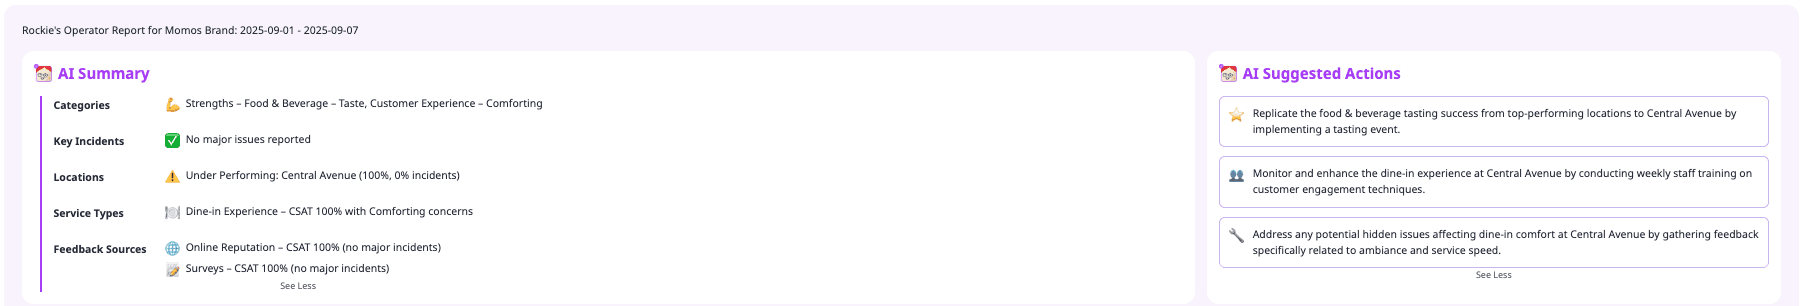
What you see: A weekly or monthly snapshot of operations, service, and guest data.
Why it matters: No more scattered dashboards. No more guesswork. Just one AI-powered report that helps every operator perform better—week after week.
2. Feedback Summary
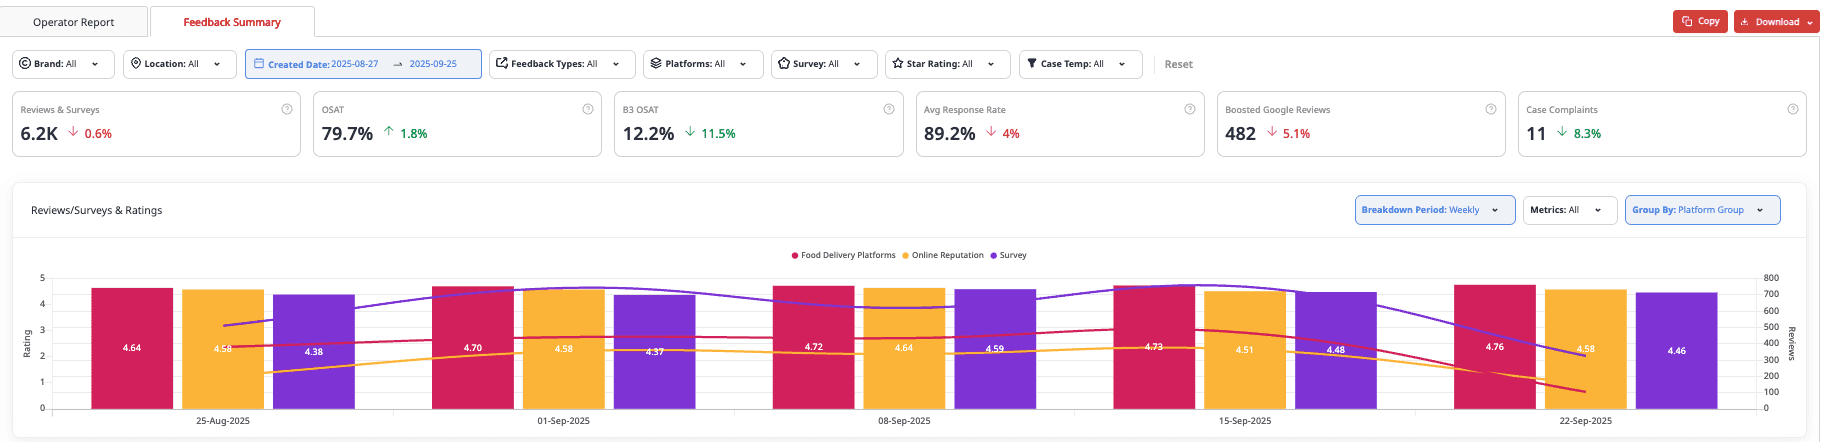
What you see: A summary showing the number of surveys, OSAT, average response rate, boosted Google Reviews, and more across different timeframes.
Why it matters: Conveniently monitor important metrics in one dashboard
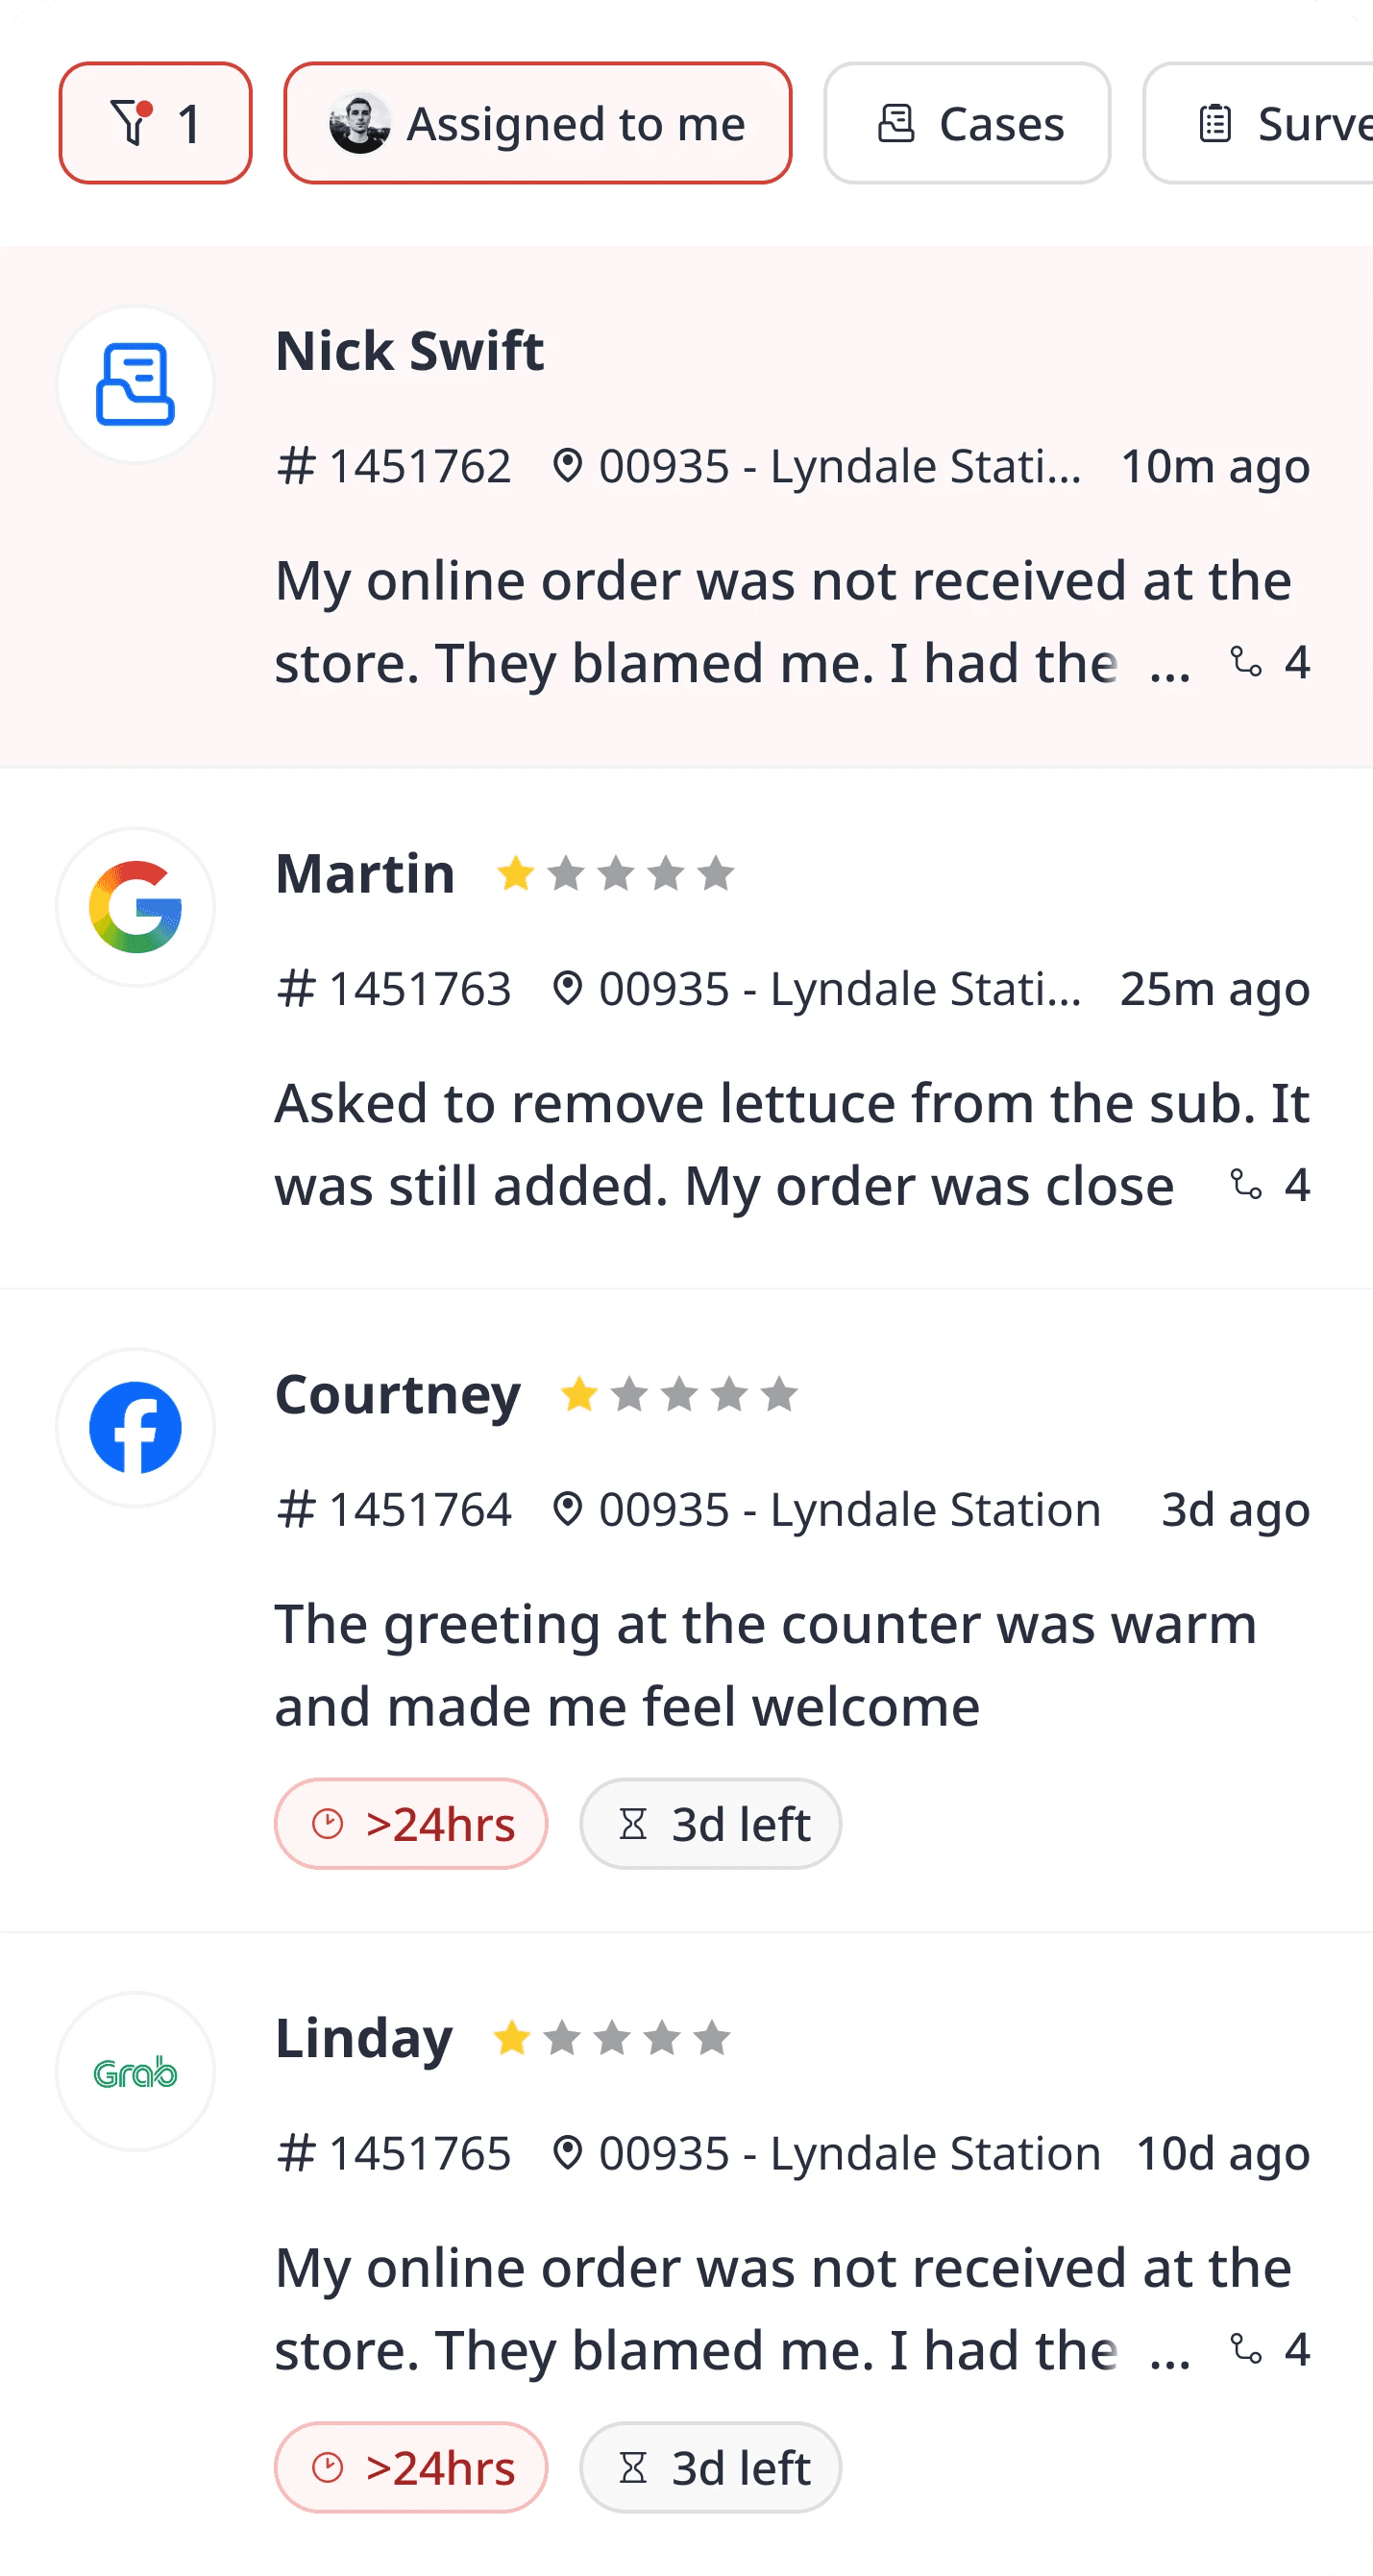
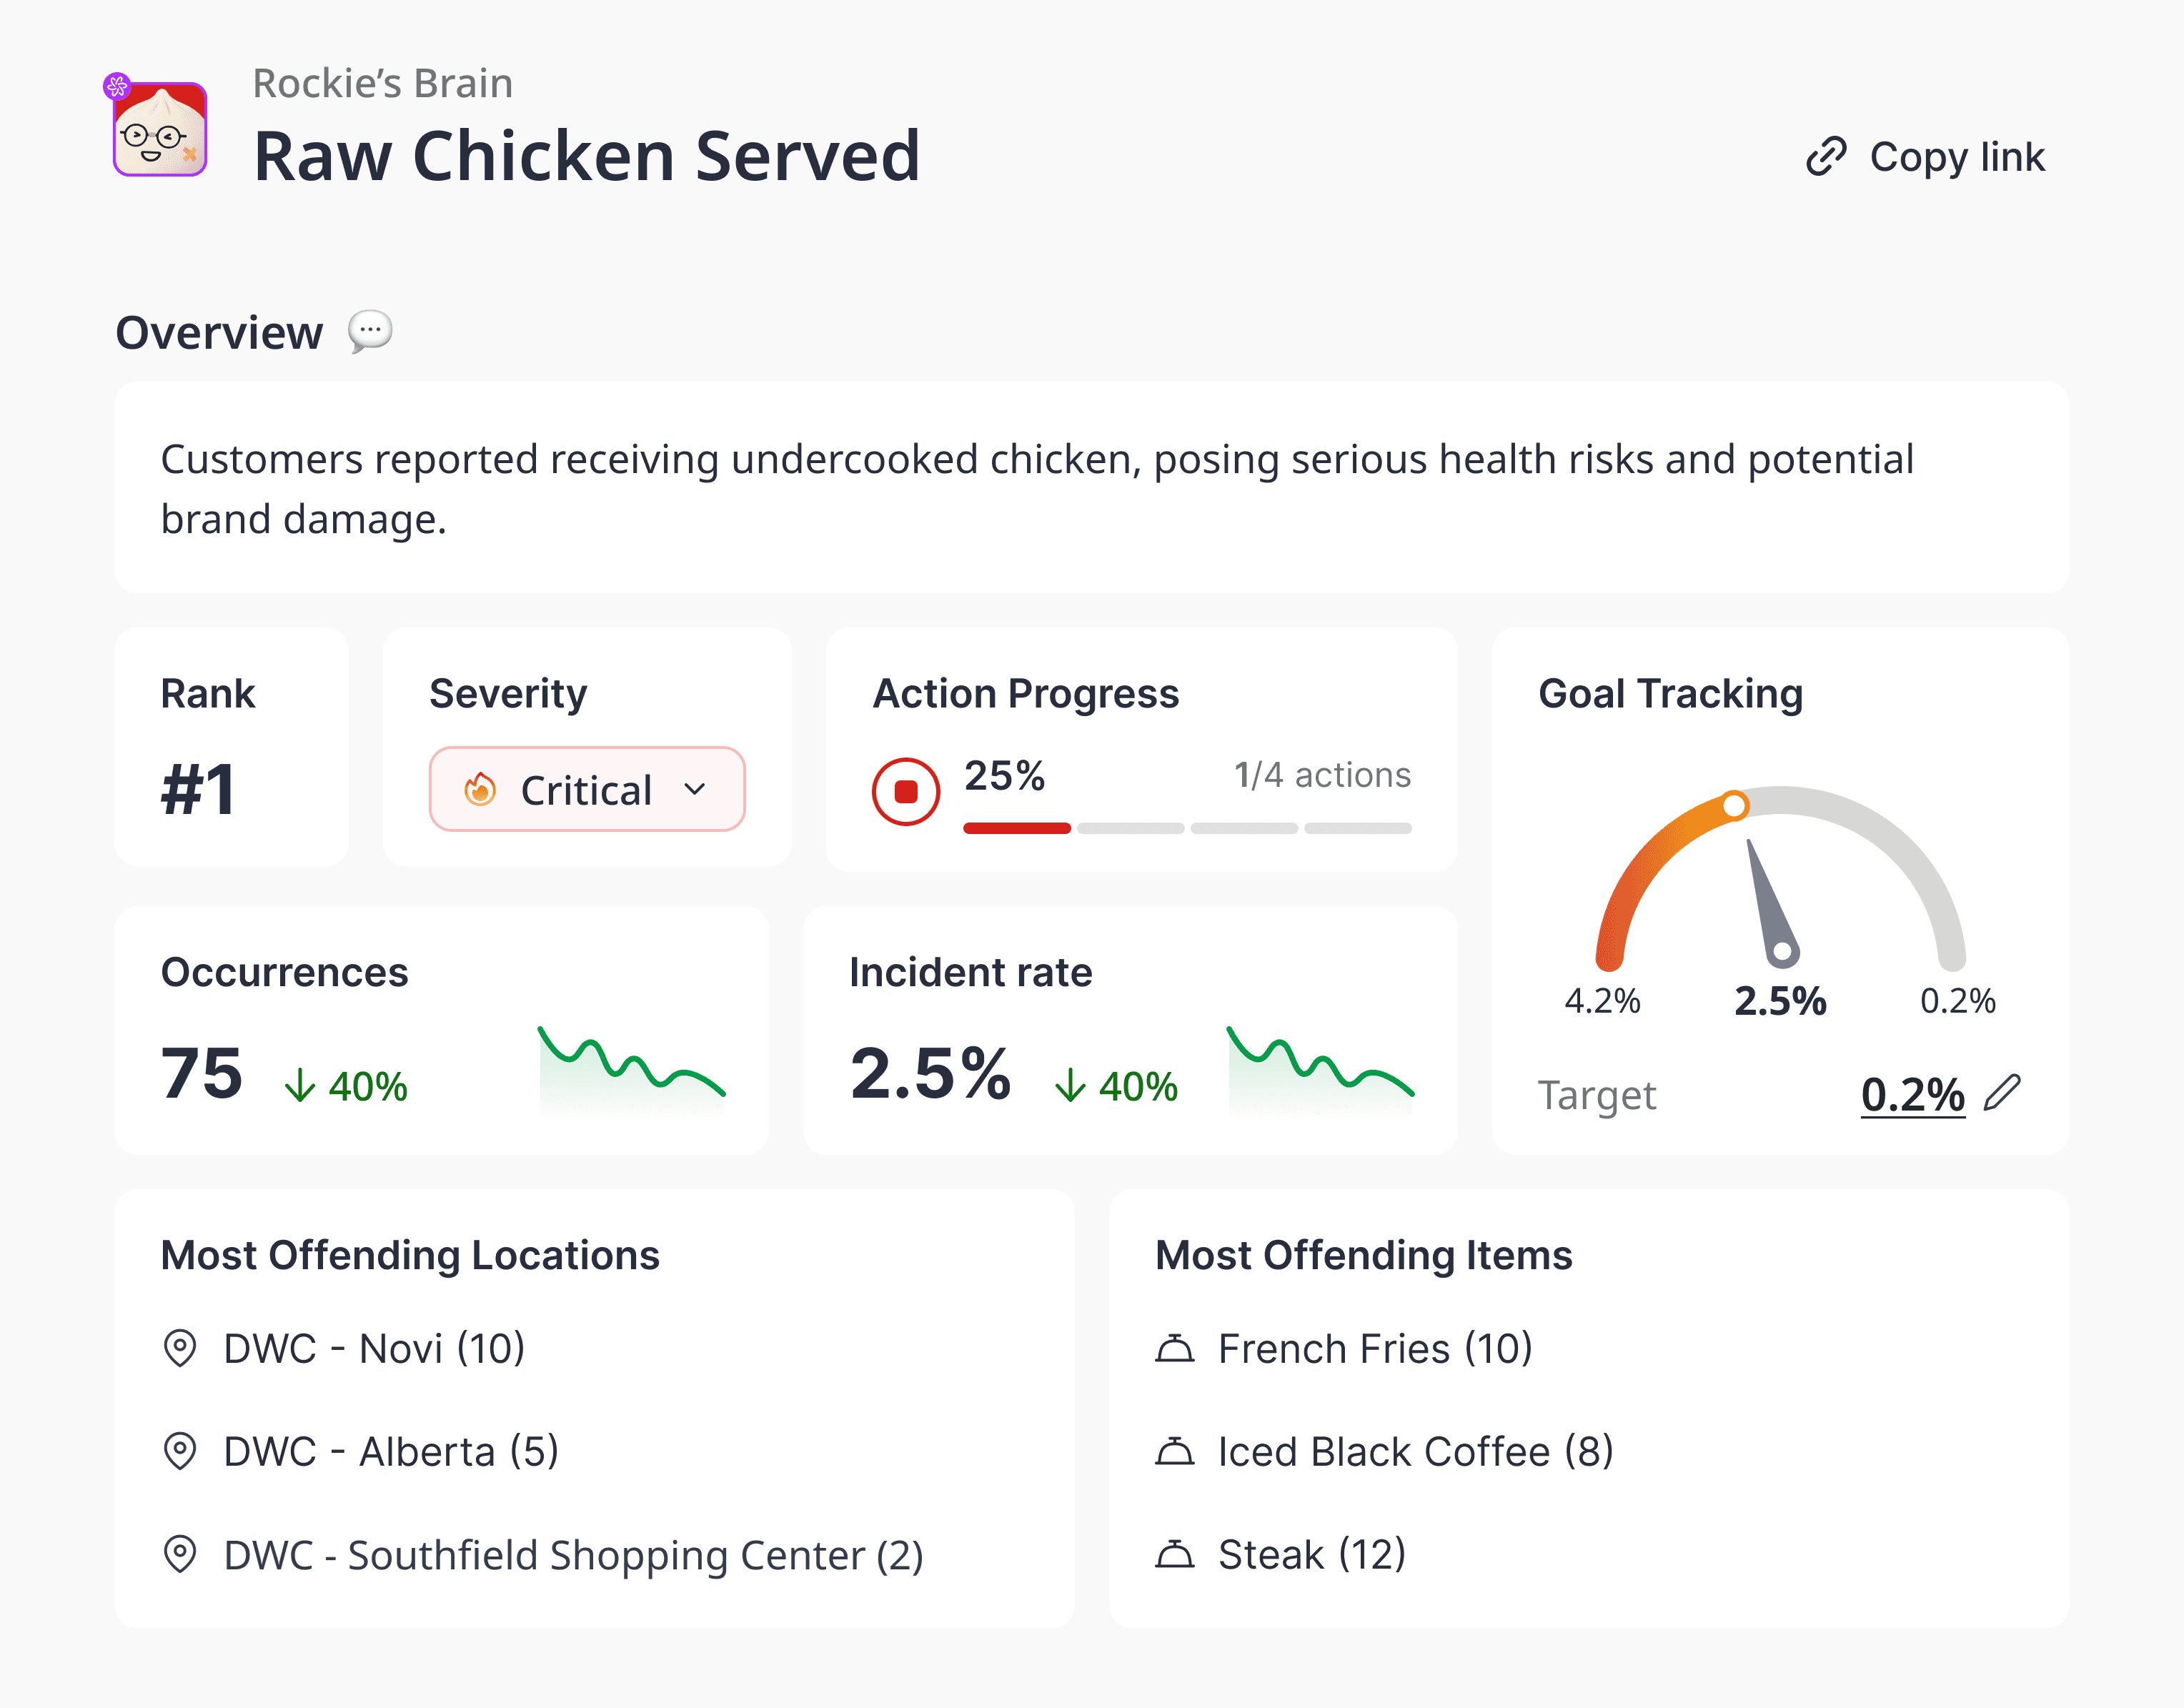
3. Incidents
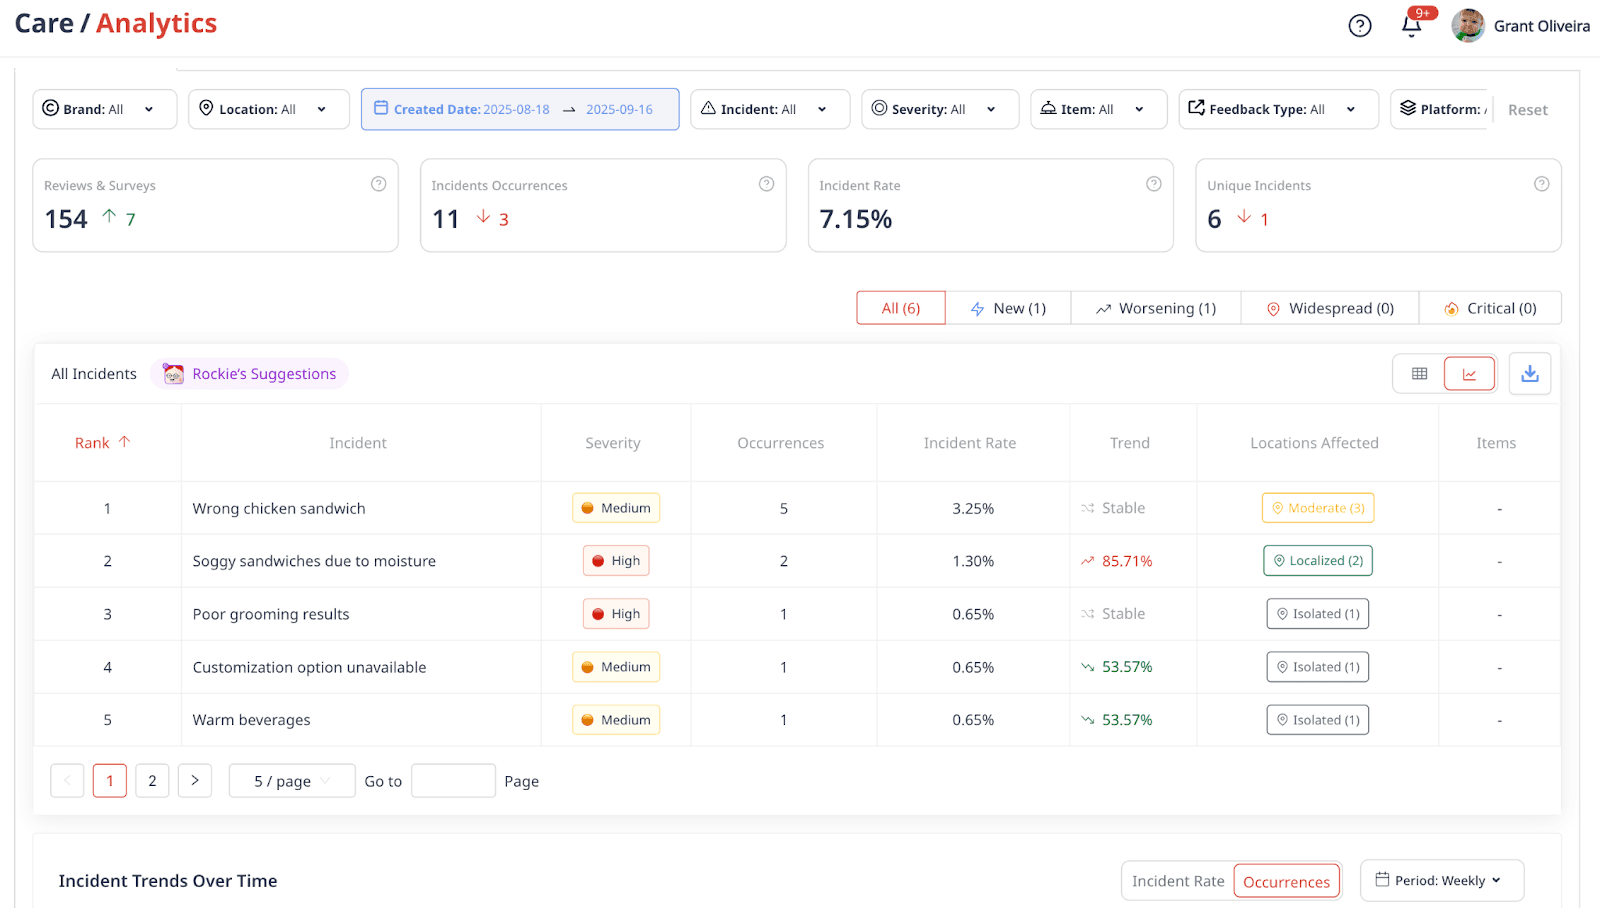
What you see: Surfaces every operational issue that’s happening across your brand—by location, item, feedback type, categories, and more.
Why it matters: Helps you uncover and fix recurring issues before they impact loyalty or revenue.
4. Leaderboard
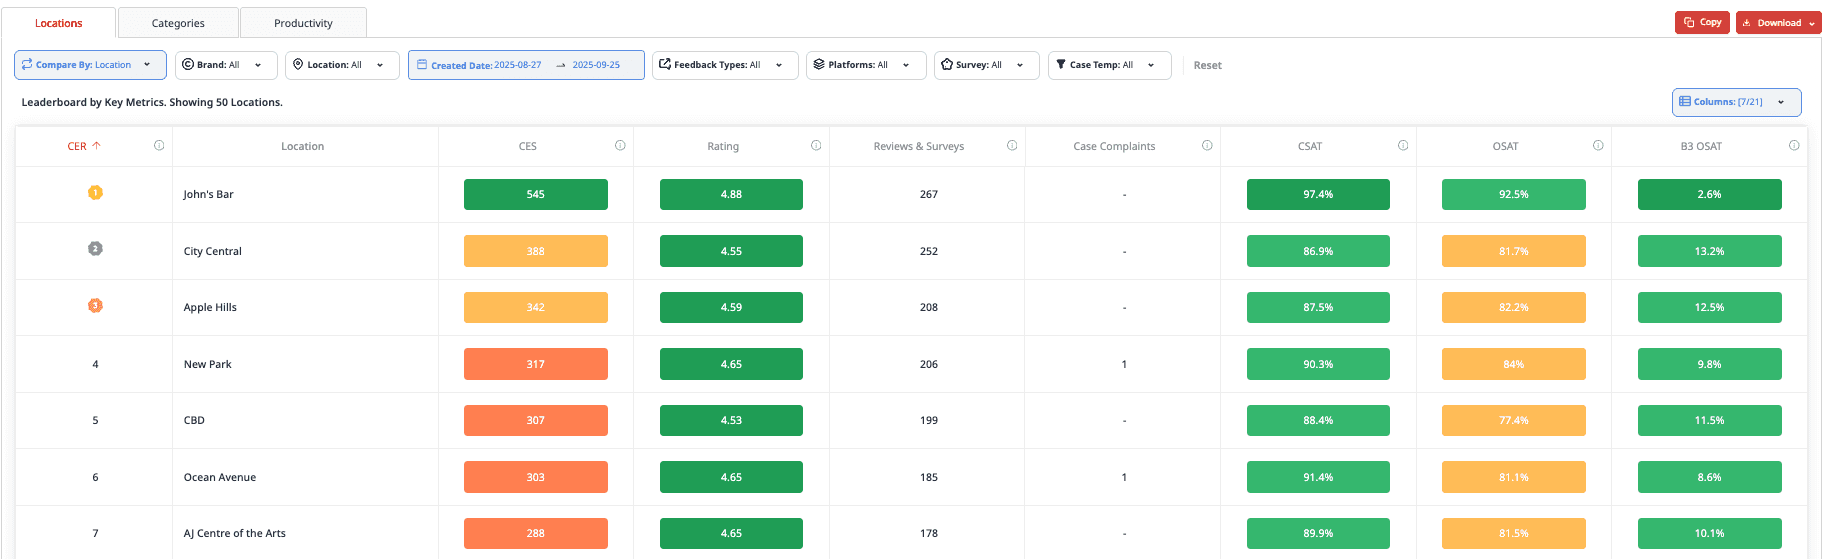
What you see: Top-down rankings by Locations, Categories, and Productivity.
Why it matters: Helps you identify which locations, categories, and teams need attention
5. Categories & Keywords
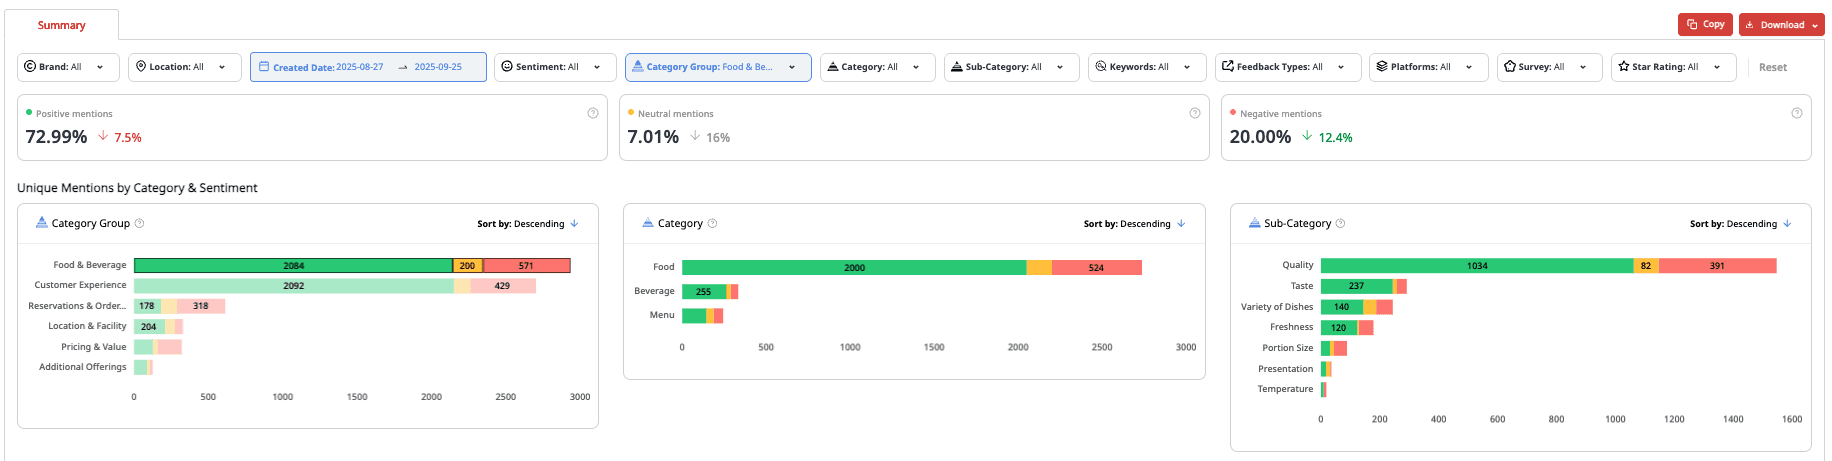
What you see: Positive, neutral, and negative mentions in categories groups. Go as detailed as possible in keywords related to service, food, staff, and more.
Why it matters: Lets you check what your customers are saying so you know precisely what to rectify
6. Survey Insights
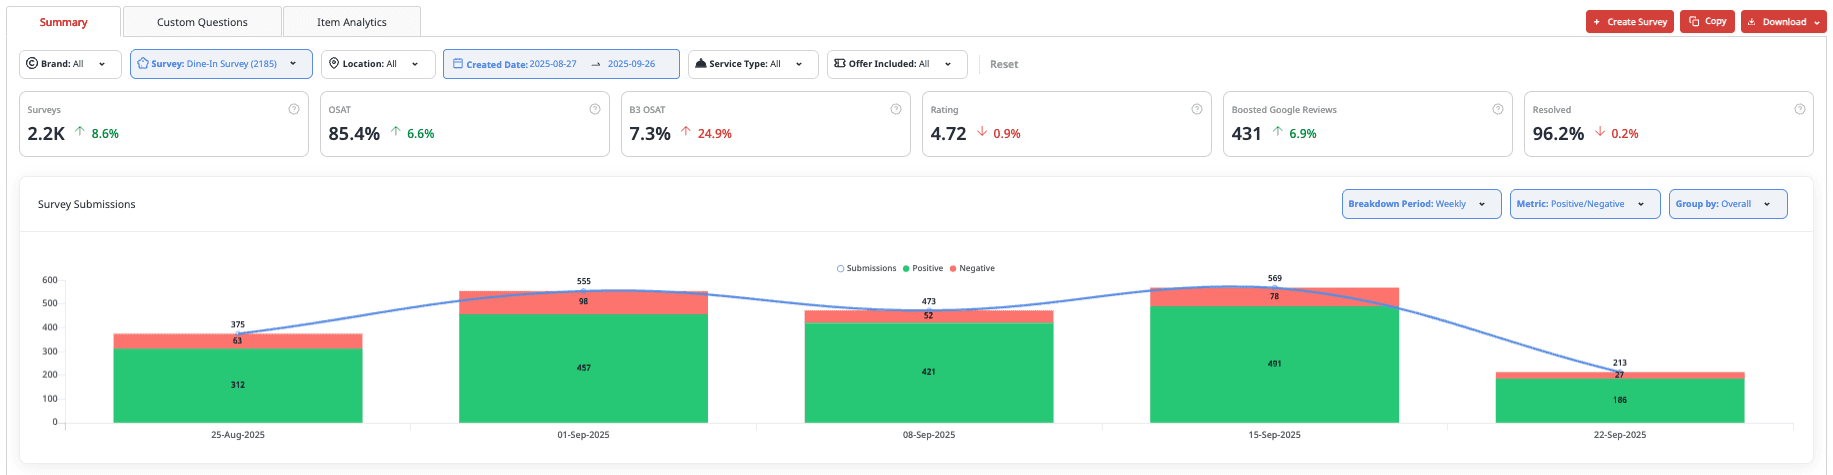
What you see: Customer sentiment, where surveys are submitted, and survey results ranked across locations, categories
Why it matters: Instead of a vague “good” or “bad,” you get a clear view of what’s driving satisfaction.
Pro tips for staying sharp
Check weekly and daily: analytics work best for spotting trends, but one-off dips could signal something brewing
Use Leaderboards in team meetings to highlight wins and set clear goals.
Ready to get your insights in minutes?
Already a customer? Check Insights in your dashboard today.
New to Momos? See how Momos turns analytics into action, fast. Sign up
Frequently Asked Questions
Do I need to be a data expert to use Insights?
No. Analytics are written in plain language and visualized for quick reading.
Can different team members see different views?
Yes. Access is based on user permissions, so managers only see their assigned locations.
Does Insights show revenue data?
Not directly, but trends in recovery, loyalty, and customer satisfaction tie closely to revenue impact.


" transform="translate(3.219 19.212)" width="152.45224485148515px"/><path d="M 0 11.619 C 7.071 11.39 33.491 21.738 40.35 21.268 C 38.499 18.19 37.116 14.915 35.507 11.625 C 33.7 7.867 32.587 3.926 31.702 0" fill="transparent" height="21.28391189647101px" id="I9fuJaf7q" stroke-dasharray="" stroke-linecap="round" stroke-linejoin="round" stroke-width="4.97" stroke="rgb(0, 0, 0)" transform="translate(139.727 55.754)" width="40.34950693069311px"/></svg>)