We looked at month-by-month data for over 500 brands on the Momos platform. We found that every +1% relative bump in reply rate is linked to a +0.01% lift in average star rating.

How Does Review Reply Rate Impact Your Restaurant Revenue?
Vincent Nguyen
Replying to customer reviews takes time and effort. So there are two important questions that restaurants often ask:
Does review reply rate improve brand's rating?
Does improved brand's rating have an impact on revenue?
To answer those questions, we use data from two sources:
-
1
Momos data | Monthly Google review history across 500+ brands
-
2
Harvard Business School | Yelp ratings and restaurant revenue
Michael Luca's landmark study of Yelp in Seattle found that a one-star rating increase causes a 5–9% lift in restaurant revenue.
The first study tells us reply rate moves star rating. The second tells us star rating moves revenue. Together, they form a domino effect your brand can capitalize on:
Improve Reply rate
→
Improve Star rating
→
Improve Revenue
Study 1. From Reply Rate To Rating
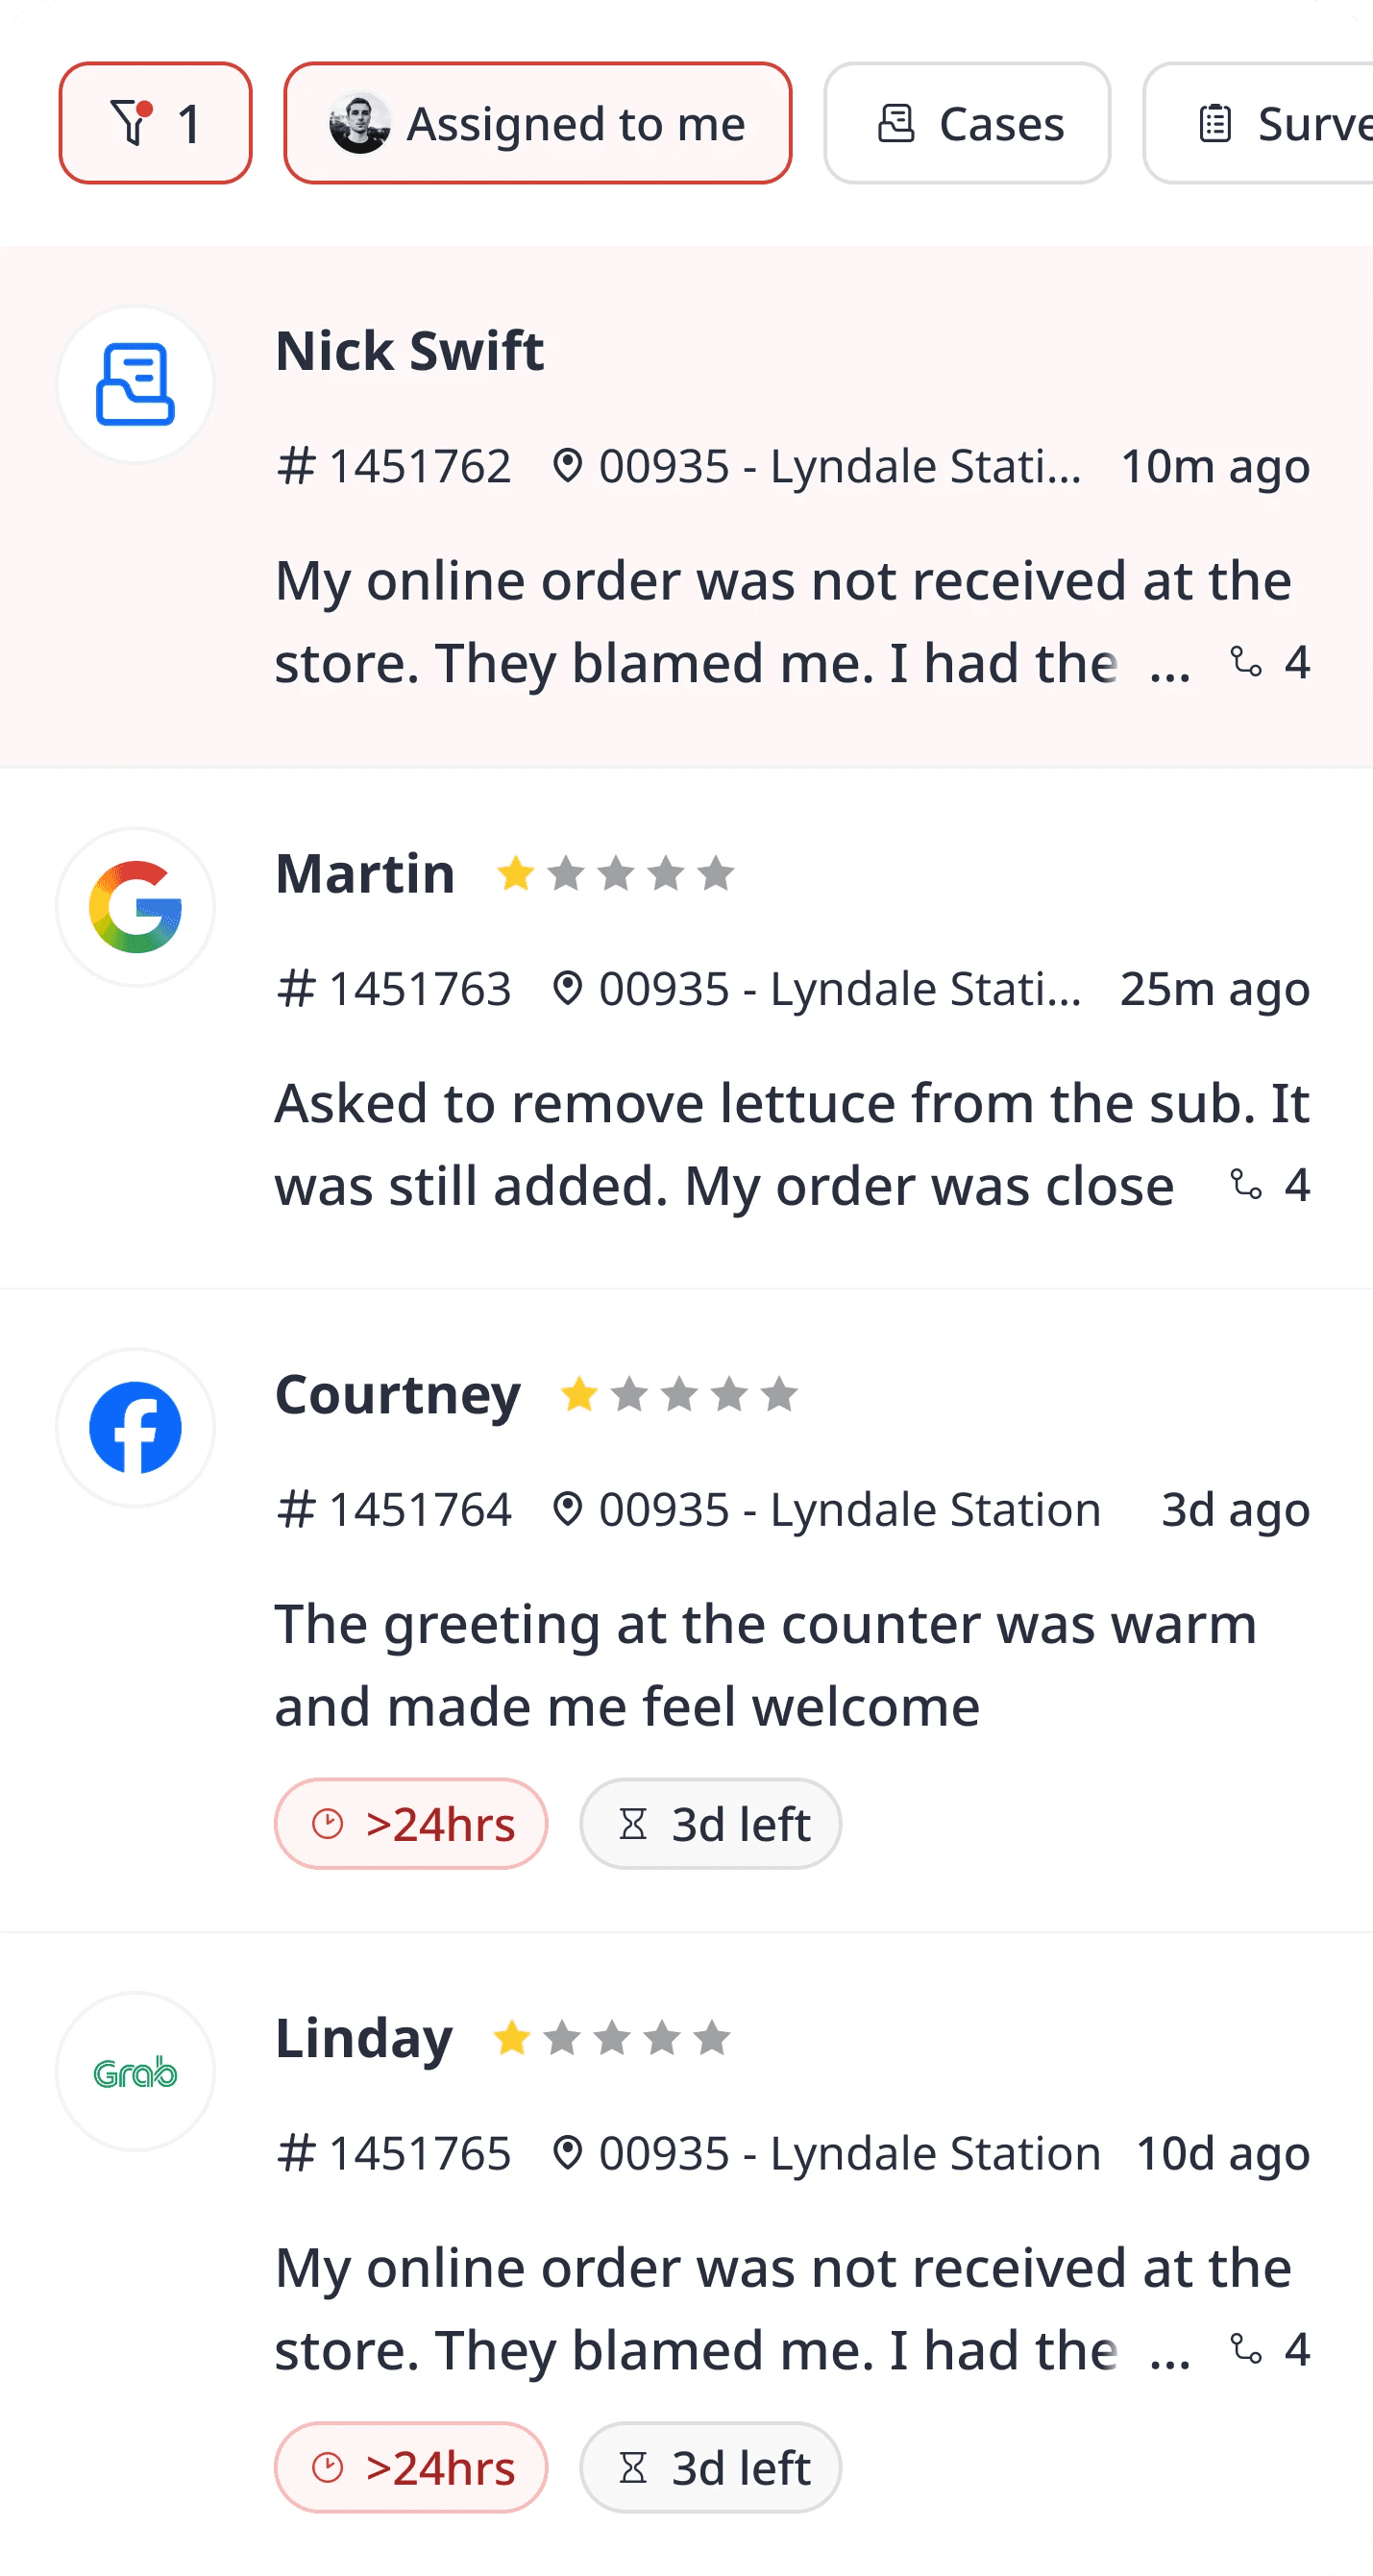
We picked two outstanding Momos Enterprise customers to analyze the impact of reply rate on star rating.
Study 2. From Rating To Revenue
If your rating moves from 3.5 to 4.0, what happens to your revenue?
To answer that question, we reference a research by Michael Luca from Harvard Business School.
This study combines a clever research design with exceptionally reliable real-world revenue data.
-
1
The research design isolates the impact of star ratings
Yelp rounds restaurant ratings to the nearest half-star. A restaurant with a true score of 3.74 displays as 3.5 stars, while one with 3.76 displays as 4.0 stars. Those restaurants are nearly identical in underlying quality, but customers perceive them differently because of the visible rating. This creates a natural experiment that lets researchers isolate the direct effect of star ratings on revenue.
-
2
The data comes from real tax-reported restaurant revenue
The study uses official sales records from the Washington State Department of Revenue covering 3,582 Seattle restaurants between 2003 and 2009. Instead of surveys or estimates, the analysis is based on actual tax-filed revenue, making the findings substantially more reliable than most hospitality studies.
The finding
A one-star increase causes a 5 to 9 percent revenue lift.
Restaurant A
Displayed: 3.5
True rating: 3.74
Monthly revenue
$100,000
VS
Restaurant B
Displayed: 4.0
True rating: 3.76
Monthly revenue
$105,000 to $109,000
Two restaurants with essentially identical quality. One rounded down, one rounded up. The half-star gap on the screen produces a real-money gap in the bank account.
Worked through the operator's lens: a restaurant earning $100,000 a month gains $5,000 to $9,000 monthly from a one-star rating gain. Annualized, that is $60,000 to $108,000 in additional revenue from a single star.
Conclusion
The research also reveals two more interesting insights.
-
1
Reviews are shifting the market toward independents.
As Yelp penetration grew across Seattle, chains lost revenue share to independents. Reviews gave independent operators a credible way to signal quality, something only chains could previously afford through national advertising. Operators who take reviews seriously are not just optimizing inside their category. They are pulling share from the one that used to dominate through brand recognition alone.
-
2
Review volume and reviewer quality amplify the effect.
A restaurant with 50 or more reviews is roughly 20 percent more rating-sensitive than the same restaurant when it had fewer than 10. Reviews from Yelp's "elite" certified reviewers carry roughly double the revenue impact of regular reviews. A 4.5 star rating backed by 12 reviews is much weaker than the same rating backed by 200. Drive volume, and pay attention to who is reviewing you.
Reply rate
→
Star rating
→
Revenue
The Final Playbook
From these two reviews, here are the actionable advice for your multi-location restaurant:
-
1
Set a reply rate target and hold every location to it
Reply rate is the lever your brand can actually pull. Set a floor of 80% and track it by location every week. The brands that pushed reply rate toward 90%+ saw their ratings follow consistently. Make it a metric your managers own, the same way they own covers or average spend.
-
2
Use guest feedback as an operational signal
Review data tells you what is working and where to improve, by location, by shift, by menu item. Build a habit of reviewing feedback in your weekly ops meeting. The brands that outperformed the model paired strong reply discipline with genuine attention to what guests were saying.
-
3
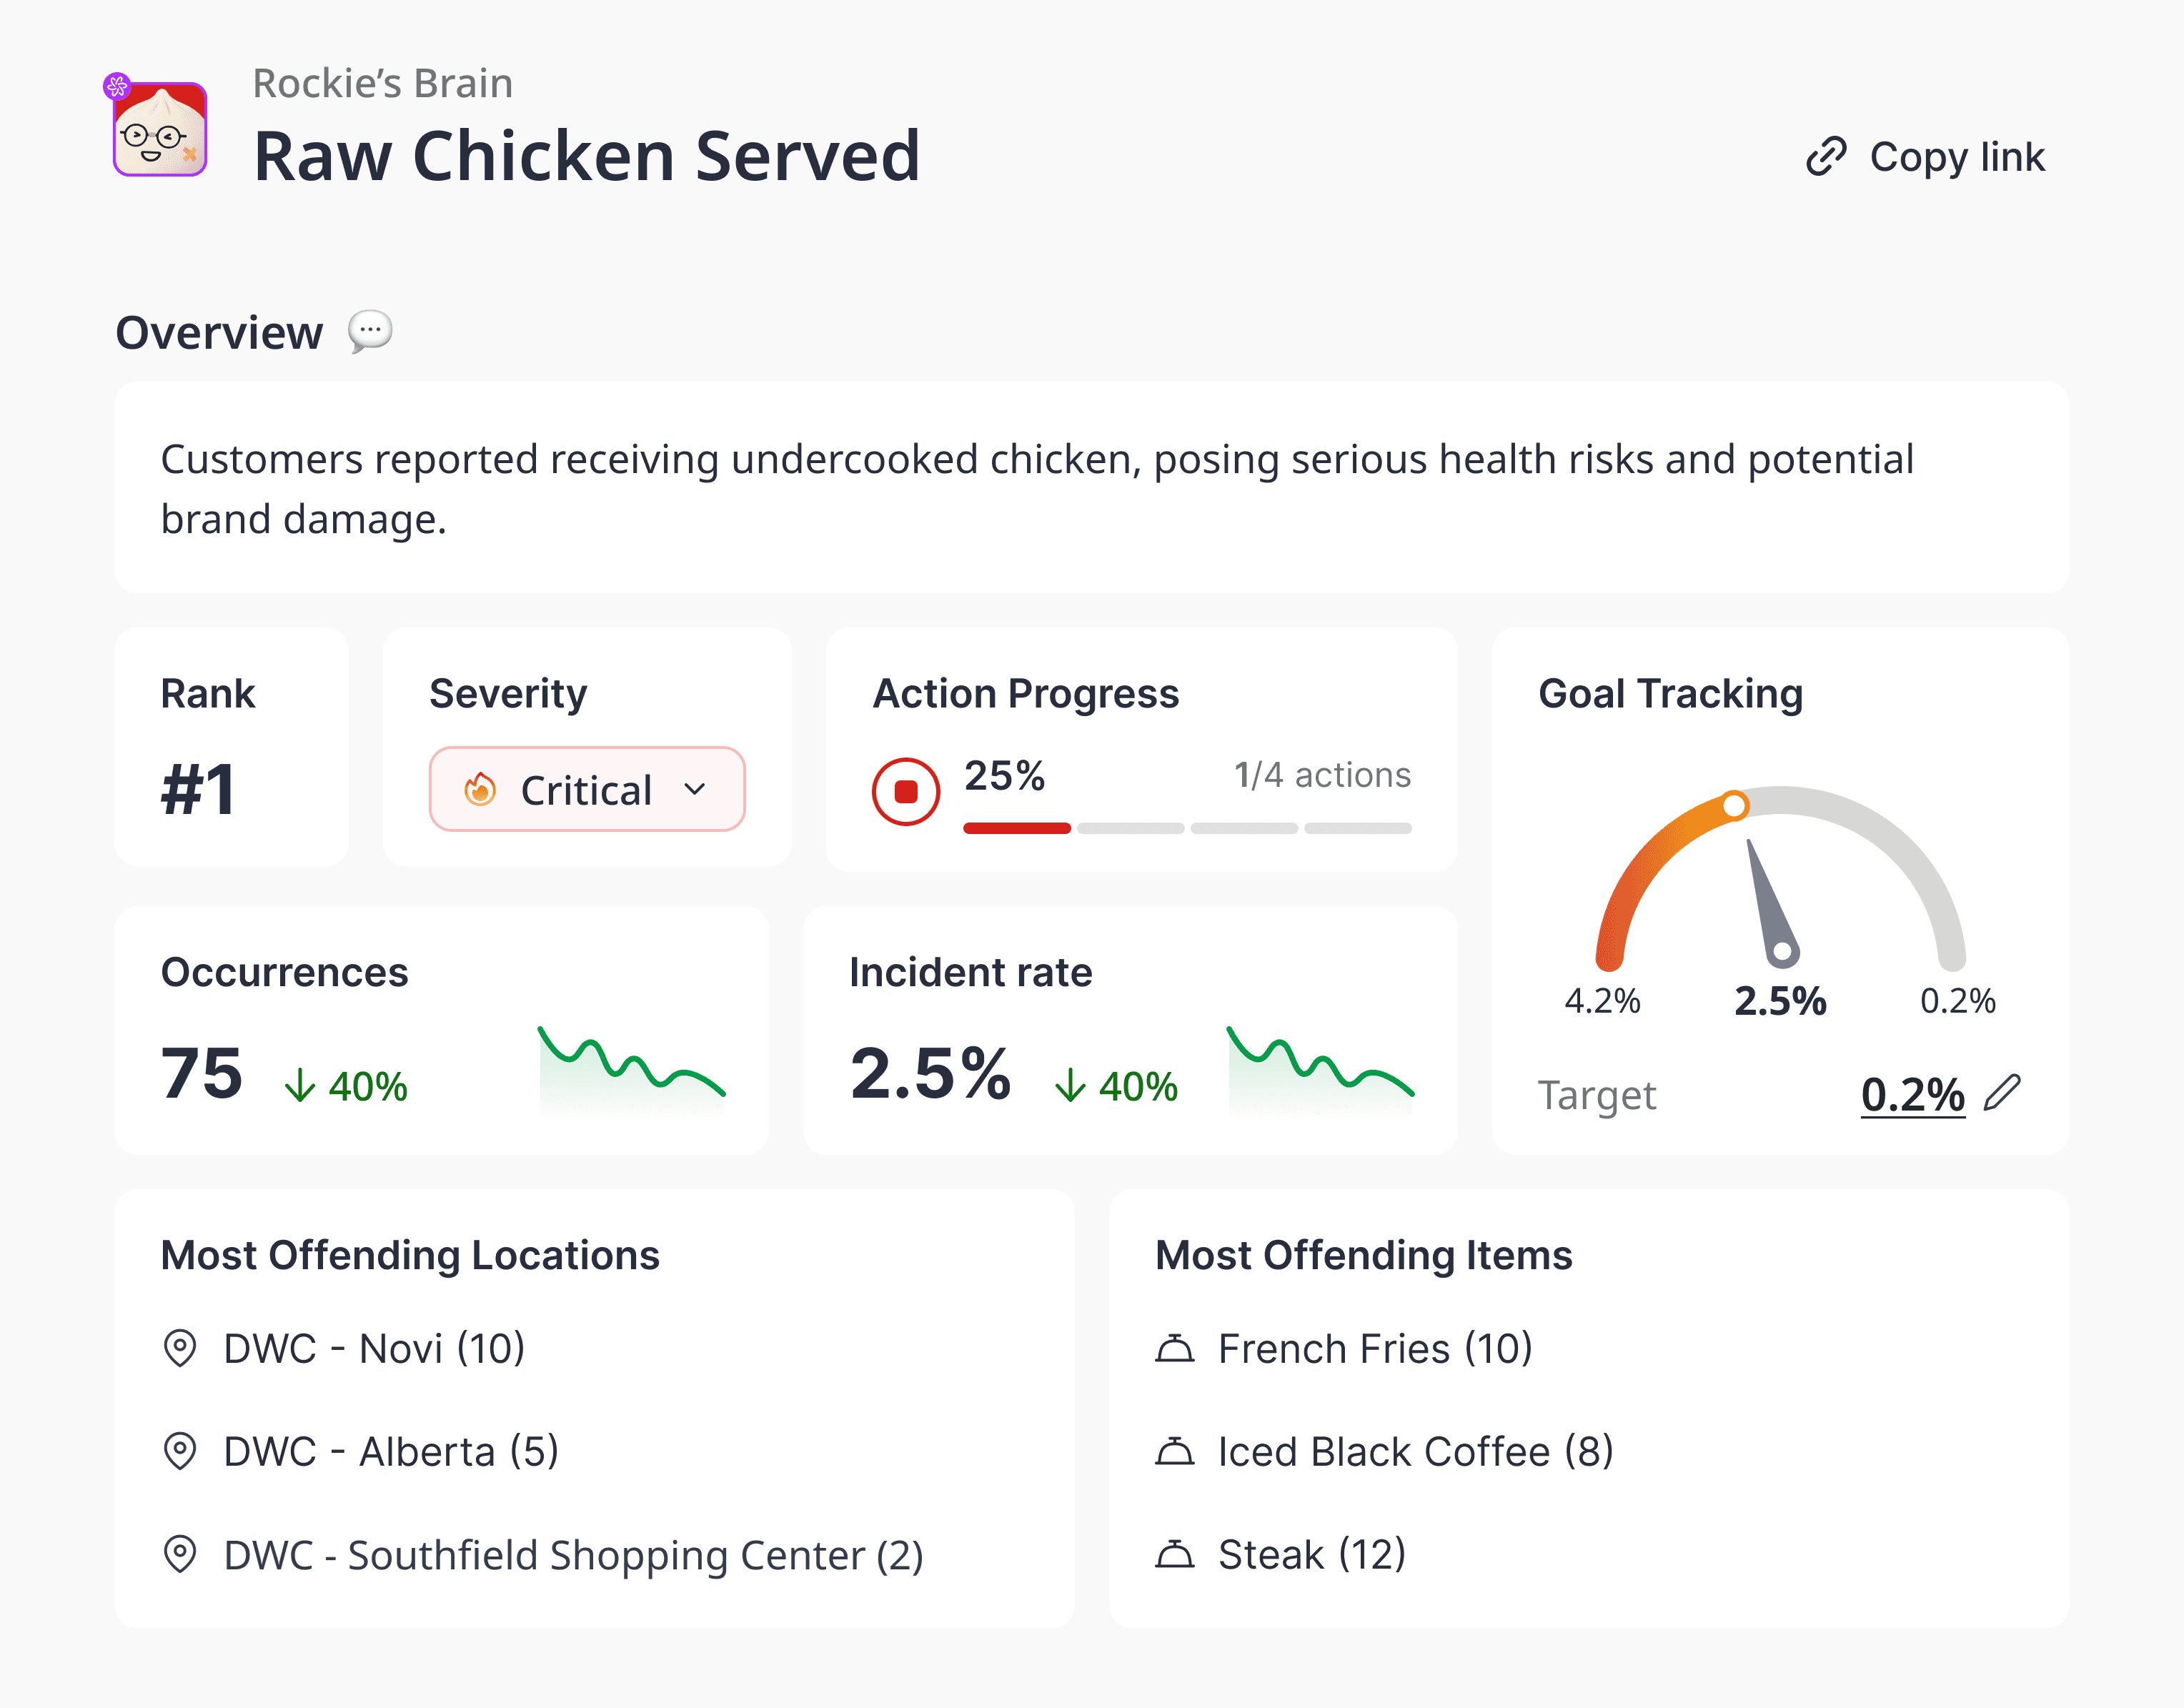
Respond to every review with care, especially the critical ones
A thoughtful response to a critical review signals to the guest and every future reader that your brand takes quality seriously. It is also one of the highest-leverage moments for guest recovery. Brands that respond well to critical reviews consistently convert those moments into stronger long-term trust.
-
4
Drive review volume, not just average score
A restaurant with 50 or more reviews is roughly 20% more rating-sensitive than one with fewer than 10. Reviews from highly credible reviewers carry roughly double the revenue impact of standard ones. Focus on generating a consistent stream of reviews, and pay attention to who is engaging with your brand online.
-
5
Treat your star rating as a revenue line
A one-star improvement in your rating is linked to a 5 to 9 percent lift in monthly revenue. For a location doing $100,000 a month, that is an additional $5,000 to $9,000 every month, or up to $108,000 annualised. Time invested in review management is among the highest-return operational decisions available to a multi-location brand.
Appendix
Data source: Internal Momos analysis. 504 brands, Google review data only, monthly aggregation. Semi-log regression model, p < 0.001. Companion analyses: full RR → Rating doc, per-brand projection table.
| Term | What it means |
|---|---|
| Reply rate | Of all the reviews a brand could reply to, the share they actually replied to. |
| Average rating | The average star rating across all of a brand's reviews on Google in a given month. |
| Baseline period | The first 6 months after the brand started being tracked on the platform. |
| Current period | The most recent 6 months for that brand. |
| Correlation (r) | How tightly two numbers move together. +1 = perfectly in sync, 0 = unrelated, −1 = move opposite ways. Anything above +0.30 is meaningful. |
| p-value | The chance the result is just luck. Below 0.05 = unlikely to be coincidence. Below 0.001 = essentially certain it's a real signal. |
| Mega Enterprise / Enterprise | Brand size tiers based on outlet count. Mega Enterprise = 100+ outlets; Enterprise = 26–100 outlets. |
 AI agents automate all guest interactions, 24/7, across all locations of your restaurant.


" transform="translate(3.219 19.212)" width="152.45224485148515px"/><path d="M 0 11.619 C 7.071 11.39 33.491 21.738 40.35 21.268 C 38.499 18.19 37.116 14.915 35.507 11.625 C 33.7 7.867 32.587 3.926 31.702 0" fill="transparent" height="21.28391189647101px" id="I9fuJaf7q" stroke-dasharray="" stroke-linecap="round" stroke-linejoin="round" stroke-width="4.97" stroke="rgb(0, 0, 0)" transform="translate(139.727 55.754)" width="40.34950693069311px"/></svg>)