¿Qué es la inteligencia de restaurantes? ¿Cómo recopilar datos en tu restaurante?
Escrito por: Vincent Nguyen

Running a restaurant means making dozens of decisions every day about staffing, menus, purchasing, and guest experience.
Many of those decisions are made with incomplete information.
When you operate a single location, you can handle a lot just by being present. As you scale across multiple locations, that intuition stops being reliable, because:
You can't be in every restaurant at once, so you depend on what managers tell you and on reports that arrive days later.
Your data sits in separate systems: the POS, scheduling, inventory, reservations, delivery apps, online reviews, and surveys.
Small problems, such as a slow station, a supplier price increase, or a dip in review scores, stay invisible until they reach the P&L.
Each location develops its own habits, and without shared numbers it's hard to tell which habits are worth copying.
Restaurant intelligence closes that gap. This guide explains what it is, which data it uses, how to collect that data across your locations, which metrics to watch, and which tools can help.
What is Restaurant Intelligence?
Restaurant business intelligence (BI) is the practice of collecting data from across your operation (sales, labor, inventory, guest feedback, and financials) and turning it into information you can act on.
Instead of checking five different systems to understand how your business is performing, BI consolidates everything into a single view that tells you what is happening, why it is happening, and what to do about it.
There is a difference between "reporting" and "intelligence". You may have many separate reports for sales, inventory, and finance, but none of them talk to each other, and none of them tell you what the numbers mean together.
BI sits above all of these systems and connects the dots.
You will also hear the terms restaurant analytics and restaurant BI. They overlap heavily. Analytics usually describes the analysis of one data set, such as sales by daypart, while restaurant intelligence combines several data sets so you can see how they affect each other.
A Practical Example of Restaurant BI
Say your Friday dinner revenue is down 12% compared to the same period last month.
You know it happened, but do you know why it happened?
With a connected BI system, you might see that the drop correlates with a 20-minute increase in kitchen ticket times on Friday evenings, driven by two items added to the menu six weeks ago that require significantly more prep time.
You'd also see that guest satisfaction scores on Fridays dropped in the same window, with complaints clustering around wait times and food arriving cold.
Meanwhile, your labor data shows that your Friday line is actually overstaffed relative to covers. The issue is menu complexity slowing down execution, and adding or removing staff won't fix it.
Without BI, you might have cut staff to reduce costs, which would have made the problem worse. With BI, you identify the two menu items creating the bottleneck, adjust or remove them, and recover the revenue.
That is what separates business intelligence from reporting. Reporting describes the past. Intelligence explains it and points to what to fix next.
⟦embed:Vlp0MqxCY⟧
Core Areas of Restaurant BI
Anywhere data is being generated, you can use it as an input into your BI system. The more of those inputs you connect, the clearer your picture becomes.
Usually, there are five major areas to keep tabs on:
⟦embed:fPtS0XrSG⟧
⟦embed:Du9Xls2pl⟧
How To Gather Business Intelligence in Restaurants?
Restaurant intelligence is only as good as the data behind it. These seven steps take you from scattered reports to a view you can trust and act on every day.
1. Start with the decisions you want to make
Before you connect any system, write down the questions your team asks every week. Which locations are falling behind, and why? Where is labor running ahead of sales? Which menu items earn their place?
Each question tells you which data you need. It also keeps you from building dashboards that look impressive but don't change any decision.
2. Map your restaurant data sources
Most restaurant groups already collect more data than they use. List every system that holds it and who owns it:
Point of sale (POS): sales, checks, covers, menu mix, discounts, and voids by location and daypart.
Labor and scheduling: scheduled versus actual hours, overtime, and labor cost.
Inventory and purchasing: stock counts, invoices, waste logs, and supplier prices.
Reservations, online ordering, and delivery apps: demand by channel, no-shows, and delivery ratings.
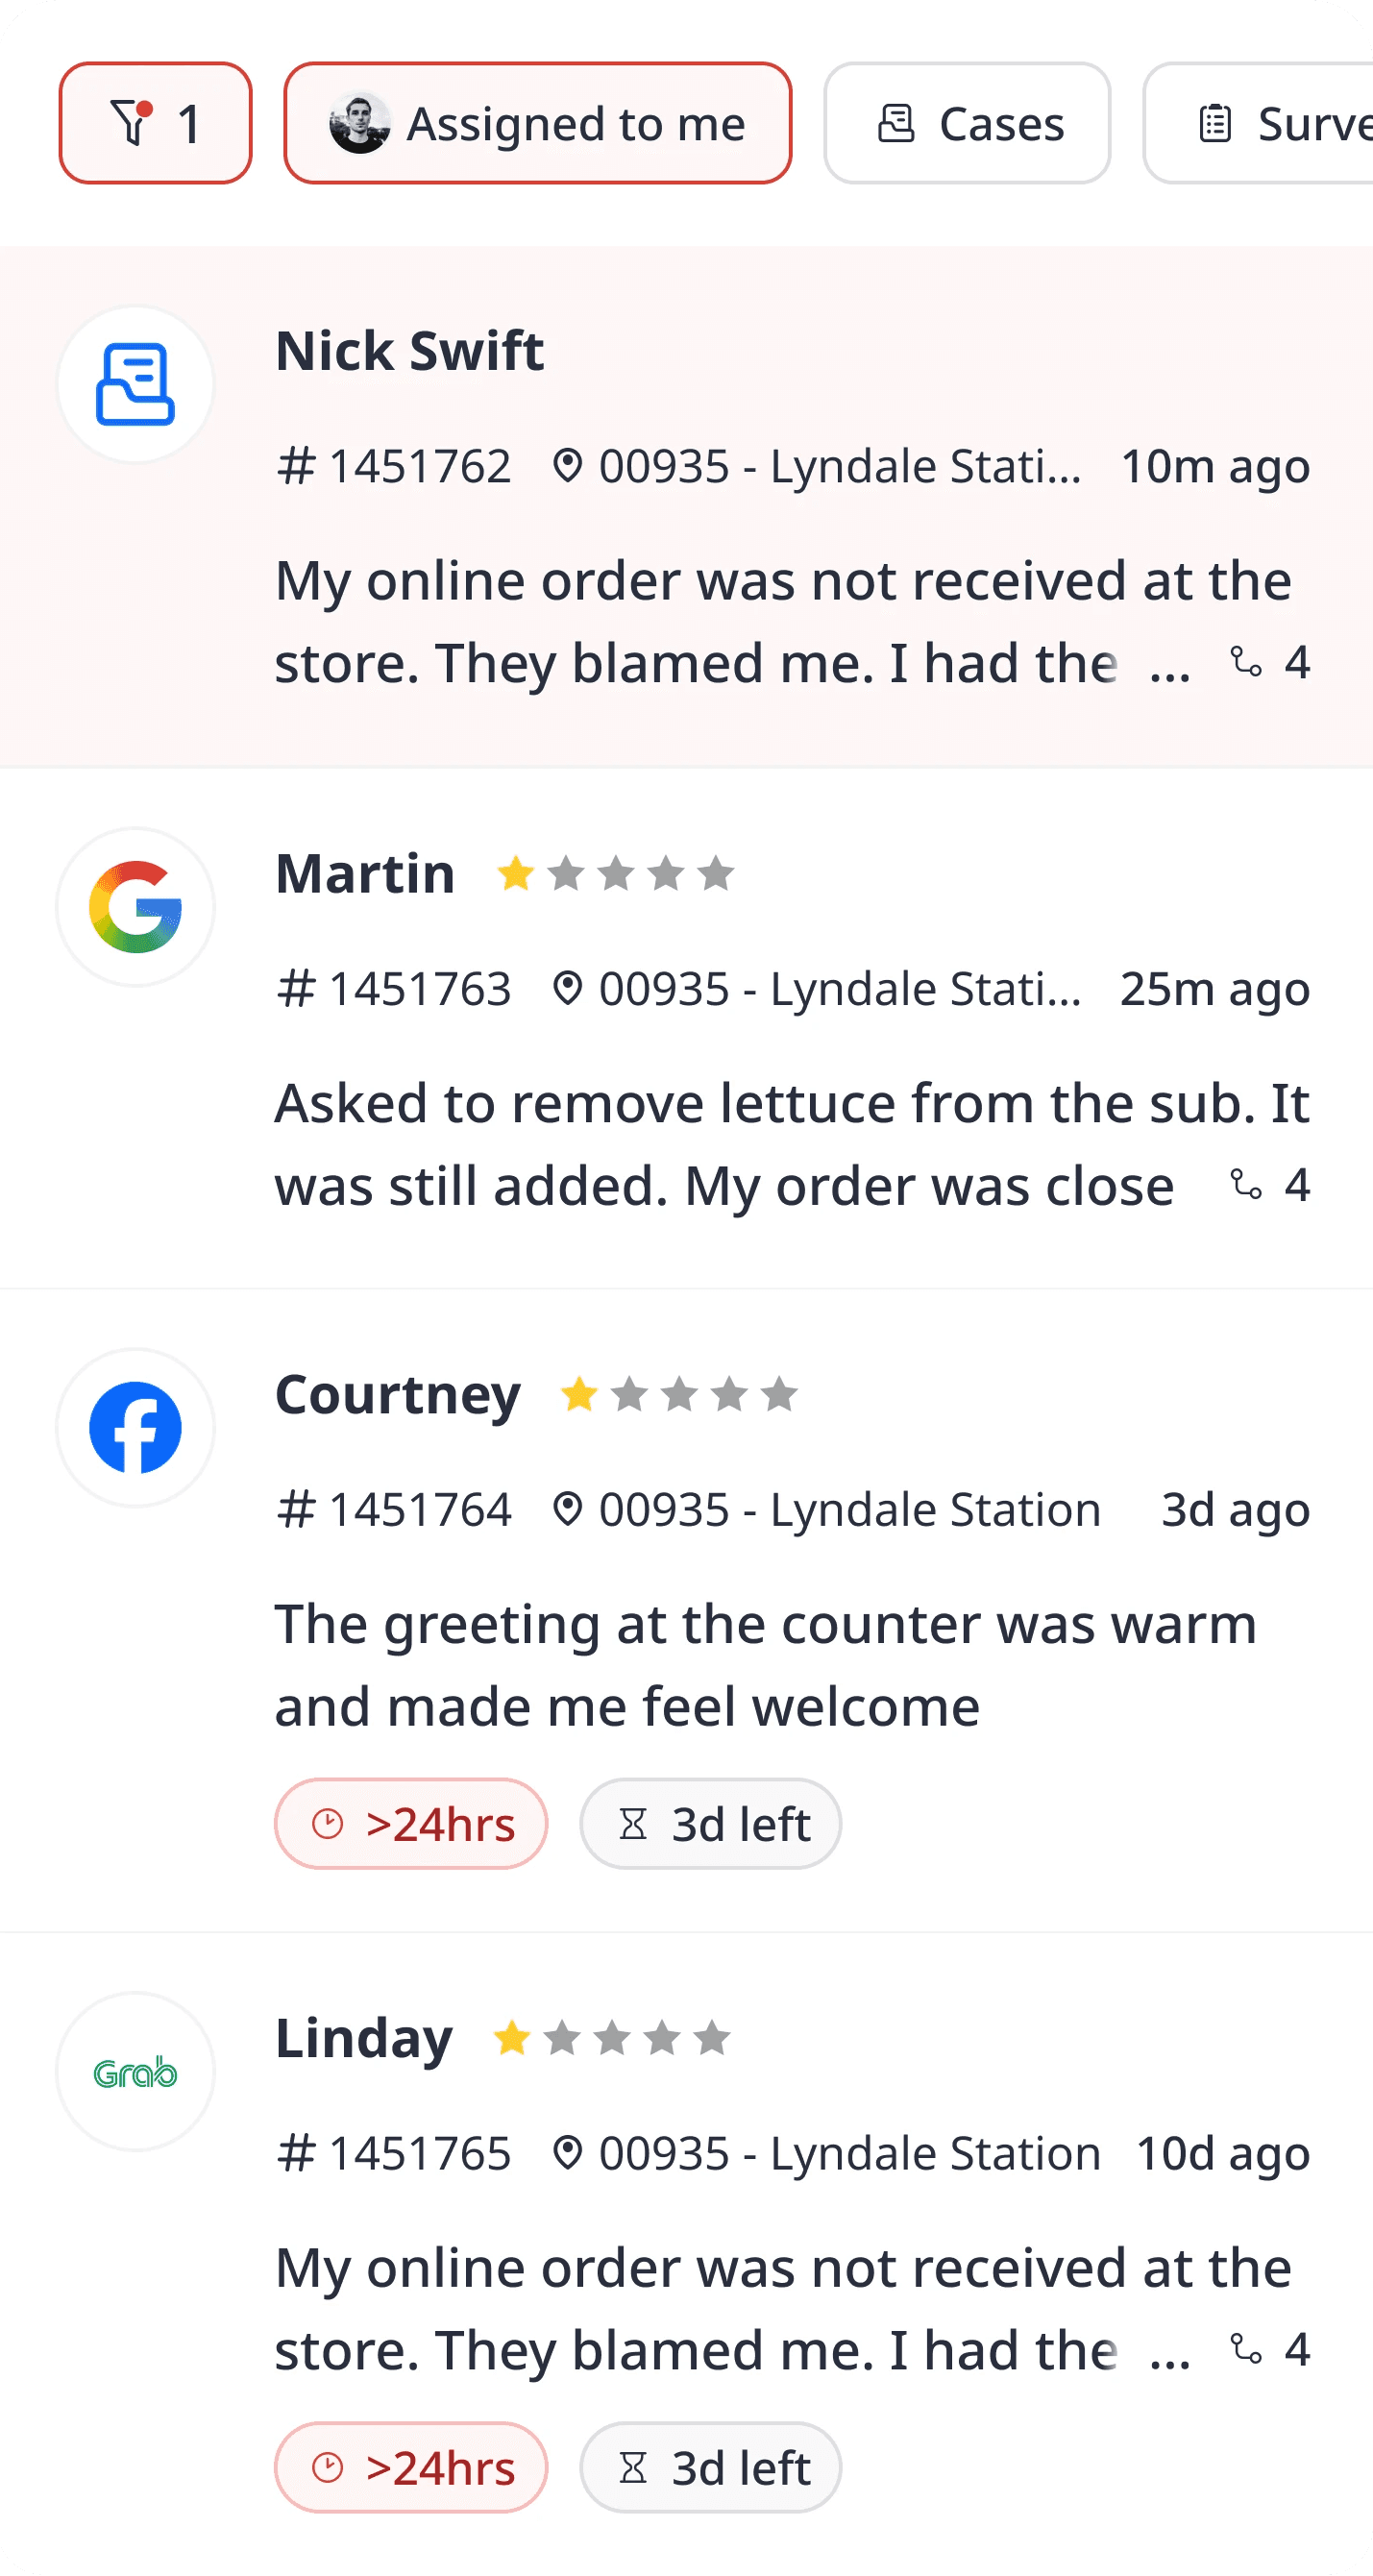
Guest feedback: online reviews, surveys, social mentions, and complaints.
Loyalty and CRM: who your guests are, how often they return, and what they order.
Accounting: the P&L, prime cost, and EBITDA for each location.
3. Connect your systems
Use the integrations your tools already offer before you consider custom work. Many POS, scheduling, and inventory platforms connect to each other directly, and BI tools pull from them through APIs.
Give each location one ID that every system shares. When the POS, the scheduling tool, and the review platform use different names for the same restaurant, comparisons break quickly.
4. Agree on shared definitions
Decide once what each number means and apply it at every location. Does "sales" include tax and tips? Is a cover a guest or a check? Does labor cost include payroll taxes and benefits?
A short written list of your restaurant KPIs and their formulas saves hours of debate later, because every manager reads the same number the same way.
5. Collect guest feedback at every location
Sales data tells you what guests did. Feedback tells you why. Combine online reviews with a short post-visit survey, sent by QR code, receipt, or email after an order, so you hear from guests who never write a public review.
Tag feedback by location, daypart, and theme (wait time, food quality, staff, cleanliness). That tagging is what lets you link a drop in scores to a specific shift or menu change, as in the Friday dinner example. Our guide on how to get customer feedback in restaurants covers the channels in detail.
6. Build dashboards for each role
Different people need different views. A general manager needs today's and this week's numbers for one location. An area manager needs to compare locations. Owners and finance need trends, margins, and prime cost across the group.
Keep each dashboard to the handful of metrics that person can act on. Everything else can live one click away.
7. Set alerts and a review rhythm
Set thresholds that trigger an alert, for example when labor cost runs above target for two days or a location receives several one-star reviews in a week. Alerts bring problems to you before the monthly report does.
Then review the numbers on a fixed rhythm: daily huddles for managers, a weekly meeting for operations, and a monthly review for leadership. Data only creates value when someone acts on it.
⟦embed:Wos_t0Hx1⟧
Restaurant Intelligence Metrics To Track
You don't need hundreds of metrics to start. These cover most of the questions restaurant operators ask, and each one is easy to compare across locations:
Prime cost: cost of goods sold plus total labor cost, usually shown as a percentage of sales. It is the biggest controllable cost in most restaurants.
Labor cost percentage: total labor cost divided by sales. Track it by daypart to find shifts where staffing doesn't match demand.
Food cost percentage: cost of food sold divided by food sales. Compare actual against theoretical food cost to find waste and over-portioning.
Average check: sales divided by the number of checks (or covers). It shows the effect of upselling, pricing, and menu changes.
RevPASH: revenue per available seat hour, or revenue divided by the number of seats times the hours open. It shows how well you use your dining room.
Table turnover and ticket time: how quickly tables turn and how long the kitchen takes per ticket. These often explain changes in revenue and in guest satisfaction.
Guest satisfaction: star ratings, Net Promoter Score, CSAT, and the themes guests mention most, tracked by location.
Review response rate: the share of reviews that receive a reply. It reflects how closely each location listens to guests.
Repeat guest rate: the share of guests who come back within a set period, from your loyalty program or CRM.
For a complete list, see our restaurant performance metrics guide.
Recommendations Of Good Restaurant Business Intelligence Software
Most restaurant groups combine a few specialized tools instead of relying on a single platform. Each tool covers one area well and shares its data with the others. Here are well-known options for each area:
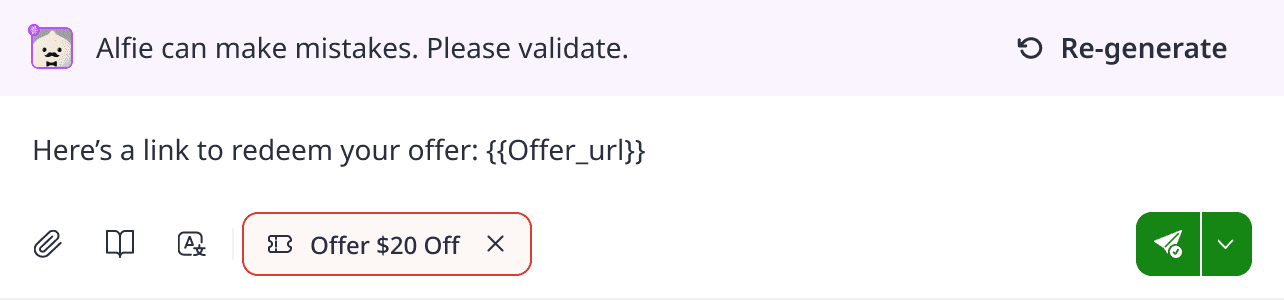
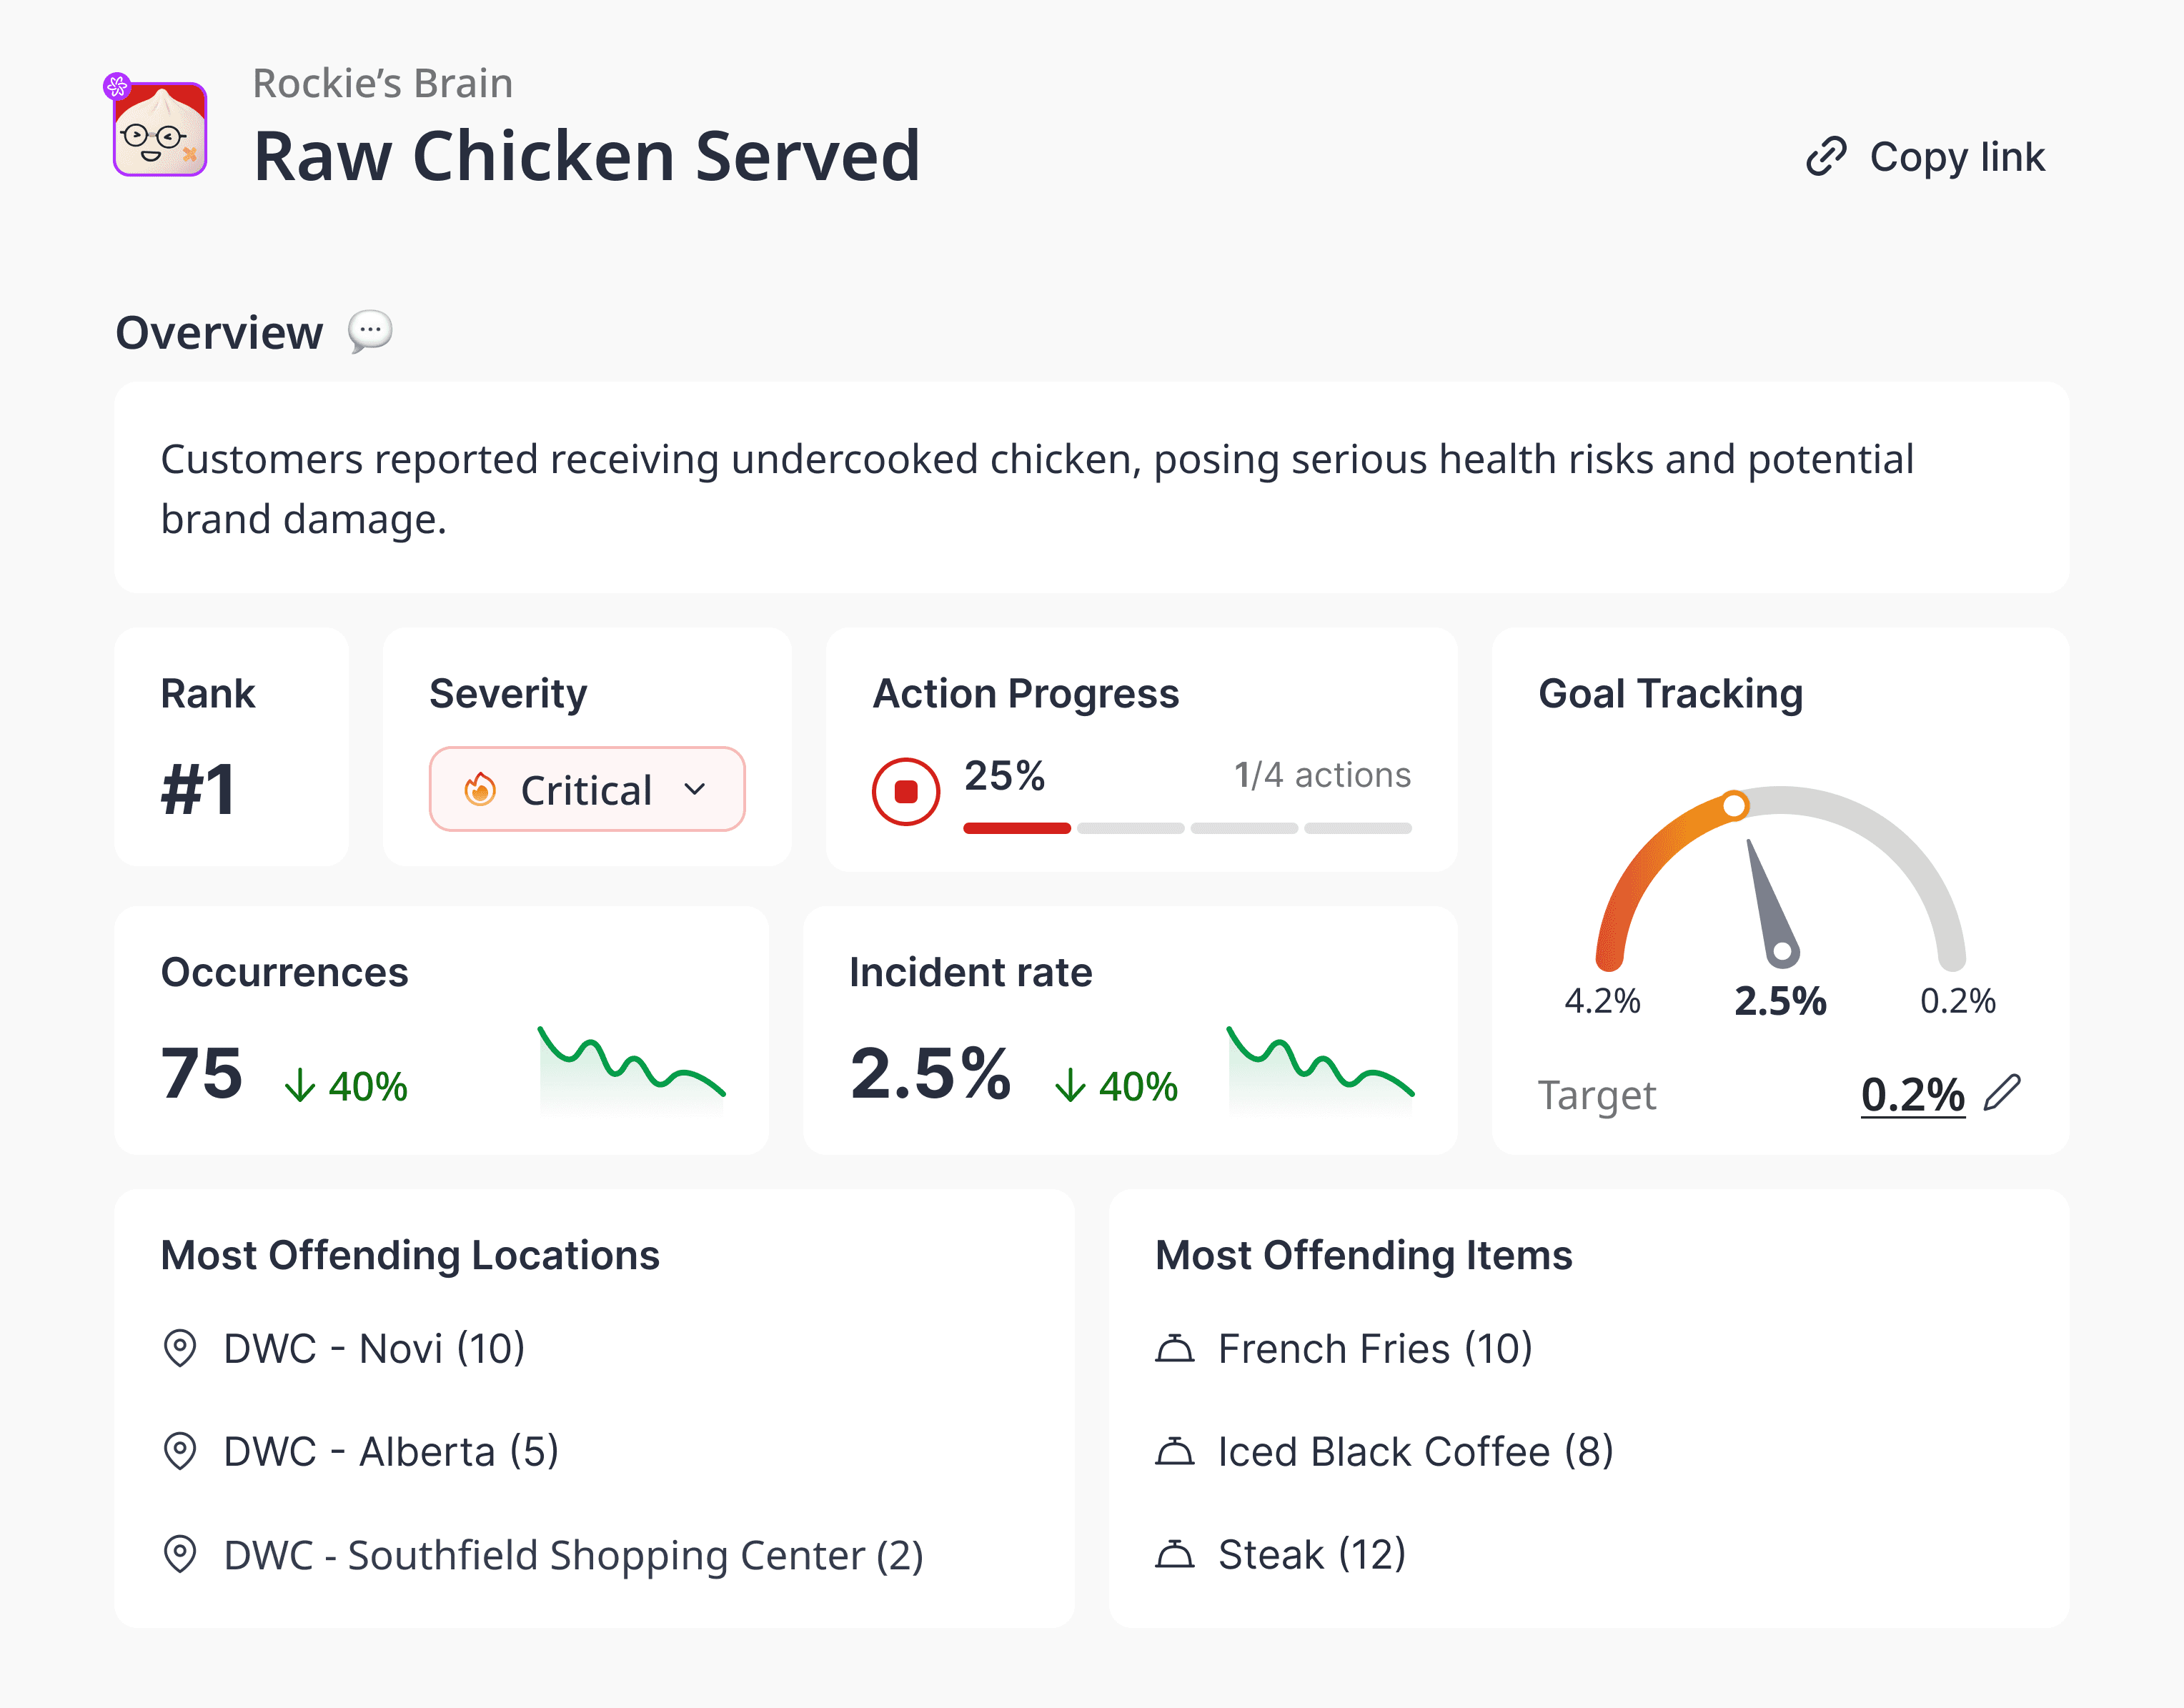
Guest experience and feedback: Momos brings reviews, surveys, and messages from every location into one place, with sentiment analysis that shows what guests praise and complain about. Its AI agent, Rockie, answers questions about your data and points to root causes.
Sales and operations dashboards: Tenzo combines POS, labor, inventory, and reservation data into one view and benchmarks locations against each other.
POS reporting: Toast and TouchBistro include sales and menu reporting inside the POS, which suits operators who want a first view without a separate tool.
Inventory and food cost: Apicbase and Restaurant365 track recipes, stock, and cost of goods, and Restaurant365 also ties them to accounting.
Labor and scheduling: 7shifts and HotSchedules forecast demand, build schedules, and track labor cost against sales.
We compare these tools, their features, and their pricing in our list of the best restaurant business intelligence software.
Common Restaurant Intelligence Mistakes
Most BI projects stall for organizational reasons rather than technical ones. Watch out for these:
Tracking everything: dashboards with dozens of charts get ignored. Start with the metrics tied to your weekly decisions.
Leaving out guest data: sales and cost data show what happened, but only feedback explains how guests experienced it.
Inconsistent definitions: if locations calculate labor cost differently, comparisons mislead you.
No owner: every metric needs a person who acts when it moves. Without one, alerts become noise.
Reacting to single data points: one bad Friday is a signal to look closer. A trend over several weeks is the reason to change a menu or a schedule.
How AI Is Changing Restaurant Intelligence
Traditional BI depends on someone building reports and reading them. AI changes that in three ways.
First, it reads unstructured data such as reviews and survey comments at scale, so themes like "cold food" or "slow service" appear without anyone tagging them by hand. Second, it watches every location continuously and flags unusual changes as they happen. Third, it lets managers ask questions in plain language, such as "why did the downtown store's scores drop last week?", instead of building a new report.
AI still relies on clean, connected data and on people who act on what it finds. The steps above remain the foundation; AI makes them faster to use. You can see how this works in practice with Momos operational insights.
Restaurant Intelligence FAQ
Is restaurant intelligence only for large chains?
No. A single restaurant benefits from connecting its POS, labor, and feedback data too. The value grows with each location you add, because comparing locations reveals what your best restaurants do differently.
What data do I need to get started with restaurant intelligence?
Start with POS sales, labor hours and cost, and guest feedback. These three sources answer most day-to-day questions. Add inventory, delivery, and loyalty data once the basics are reliable.
What is the difference between restaurant analytics and restaurant intelligence?
Restaurant analytics usually looks at one area at a time, such as sales by daypart. Restaurant intelligence connects several areas so you can see cause and effect, for example how a menu change affected ticket times, reviews, and revenue together.
How long does it take to set up restaurant BI?
It depends on how many systems you connect and how clean your data is. Tools with ready-made integrations can show first dashboards quickly, while agreeing on definitions and building review habits across a team takes longer. Starting with one area and expanding works better than connecting everything at once.
How does guest feedback fit into restaurant intelligence?
Guest feedback is the part of restaurant intelligence that explains the numbers. When sales drop at a location, reviews and survey comments from the same period often show the cause, whether that's wait times, a menu change, or staffing.

 Los agentes de IA automatizan todas las interacciones con los clientes, las 24 horas, los 7 días de la semana, en todos los locales de tu restaurante.


" transform="translate(3.219 19.212)" width="152.45224485148515px"/><path d="M 0 11.619 C 7.071 11.39 33.491 21.738 40.35 21.268 C 38.499 18.19 37.116 14.915 35.507 11.625 C 33.7 7.867 32.587 3.926 31.702 0" fill="transparent" height="21.28391189647101px" id="I9fuJaf7q" stroke-dasharray="" stroke-linecap="round" stroke-linejoin="round" stroke-width="4.97" stroke="rgb(0, 0, 0)" transform="translate(139.727 55.754)" width="40.34950693069311px"/></svg>)